8. Host-level Examination
Once you have added data to Cyber Triage® from one of the collection methods previously listed and automated analysis has started, then your goal will be to review the results. Cyber Triage will assist you as much as possible to find all evidence.
The assisted examination process can start while the artifacts are still being analyzed. Some teams choose to wait until the end. Others start right away.
8.1. Basic Workflow
We recommend four phases of investigating a host:
Get a quick overview of the system. This is the ‘Summary’ part of the Cyber Triage UI. See Summary Section.
Review what Cyber Triage scored as Bad and Suspicious and correct the scores. This is the ‘Review Notable Items’ part. See Review Notable Items Section.
Dive into individual artifacts if you need to. This is the “Review All Items” part of the UI. See Examine All Items Section
Generate reports for human or machines to use. You can also generate reports at the incident-level when all of the hosts are complete.
You’ll see this flow in the top of the UI once you open a host.
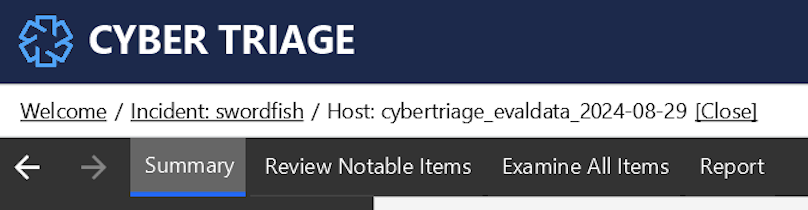
If you ever want to go back to the Incident Dashboard, use the “Close” link in the upper left.
As you navigate around the UI investigating the endpoint, you can use the arrows in the upper left to go back in your history. This is useful when you see something suspicious, click around to investigate it, and then want to go back to your original place to continue your review.
Backward and Forward Arrows
8.2. Scores
Scoring is a core part of how Cyber Triage makes you more efficient. Scores come from two basic approaches:
Automated analysis pipelines that start when data is ingested.
Manual scoring applied by the examiner. These scores overrule any automated analysis scores.
The scoring algorithms are dynamic and the score of an item will change as it and other items go down the pipelines.
8.2.1. Score Levels
The following scores can be assigned:
Bad: The associated item is very likely to be associated with an attack. The approaches used to assign this score have low false positive rates. Examples include multiple malware scanners, bad lists, and threat intelligence from past incidents.
Suspicious: The associated item has characteristics that make it anomalous or similar to what is seen during an attack. But, it could also be normal behavior and the examiner should make the final decision. Examples include logon behavior or usage of programs.
Good: The item was part of a “Good List” or manually identified as good. This score is for items that are OK and not associated with an attack.
Unknown: The item’s relevance is unknown. All items start as ‘Unknown’. You can downgrade a Bad or Suspicious item to be unknown if they original score was a false positive.
Your initial responsibility is to confirm the Bad items and decide on the Suspicious items. You can also review the other unknown items and score them.
8.2.2. How To Manually Score an Item
In various parts of Cyber Triage, you’ll be able to change the score of an item after you’ve selected it in a table.

Change Score
Bad: Use this score if you know the item is related to an incident and want it to be reported on.
Suspicious: Use this score if you want to make sure you review it again in the future. This can be used as a bookmark for your workflow.
Unknown: Use this if the current Bad or Suspicious score is not correct and you want to “undo” them, but not declare that the item is Good. This item could go back to bad or suspicious in the future from automated pipelines.
Good: Use this score if Cyber Triage® marked and item as Bad or Suspicious and you want to make sure it is treated as Good no matter what. No automated analysis pipeline will override this.
After you change a score, you may also want to consider using the:
Add Comment button to store free-form text about the item. This will get included in the final report and be visible to future investigations that come across the same item.
Add Label button to apply a label (tag) to the item. You can use labels however you want, but the intended way is to describe why the item is relevant or how you want to organize reports. See Labels for more details on label management.
8.2.3. Score Propagation To Other Instances
When you change an item’s score, Cyber Triage will recommend additional items:
- Other Instances on the Same Incident: If you change the score of an item to Bad, Suspicious, or Unknown, and it occurred other times in the incident (same host or other hosts), those will be recommended. For example, if you change the score of a process and that process ran dozens of other times, then those will be recommended. If other instances come in after you change this score, then:
If you changed the original score to Bad, they will be automatically scored as Bad
If you changed the original score to Suspicious or Unknown, then you’ll have to change their score
Future Hosts: If you scored an item as Bad, Cyber Triage will automatically apply that score to future incidents of that item as well. This behavior is applied only for Bad scores and has certain checks to not propagate “Living off the Land” processes. See Previous Incidents.
Making manual score changes will never impact the Good or Bad Lists. You will need to explicitly add items to those.
8.2.4. Score Propagation to Related Items
Cyber Triage will also recommend related items when you score an item. A related item is one that uses the same path, process, etc.
The idea is that you may find these other items interesting and you should follow up on them. You will get a dialog such as this:
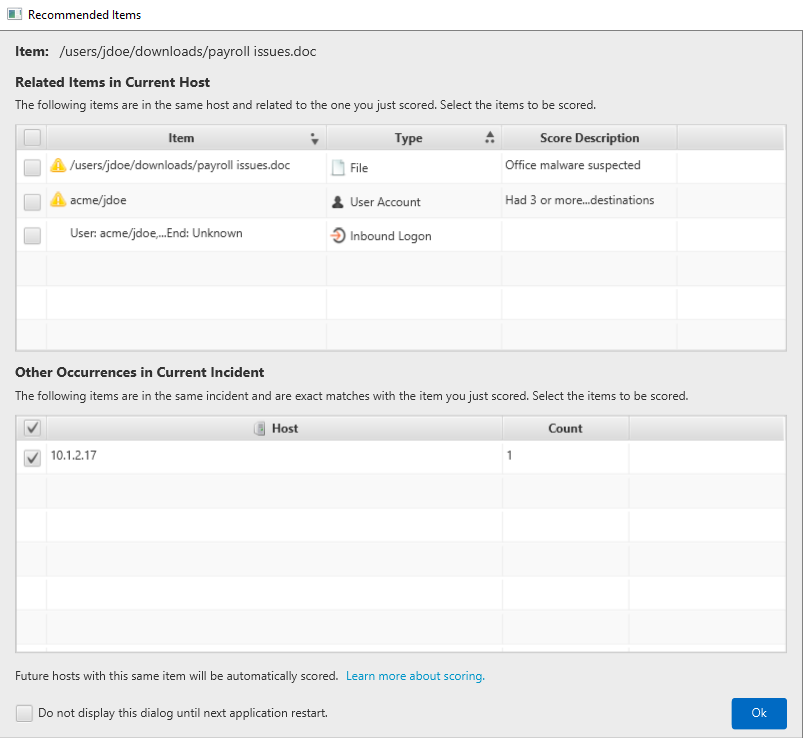
Recommended Threats
In this example, we marked a DLL as bad and it recommend a process that had loaded that DLL. It also recommended two additional hosts that had the same DLL. By default, they all get scored.
8.2.5. Labels
8.2.5.1. Basic Concepts
While scores are the primary way in Cyber Triage to identify which items are relevant to an incident, you can also use labels as a way to organize the results. The common ways of using labels are to:
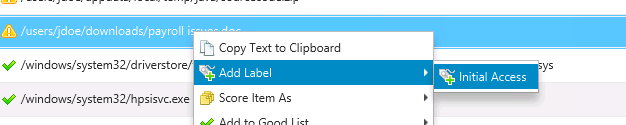
Describe why a bad item is relevant. For example, labels of “Lateral Movement” or “Initial Access”.
Group related bad items. For example, if a previous incident was detected while analyzing a host, you could use a “2022 Incident” label to group the previous incident.
Track settings or items that are not related to the incident, but you want to keep track of to make future recommendations. For example, if you notice an OS setting that is incorrect, but it wasn’t involved in the incident, you could create a label to follow up on it. In this case, it is not appropriate to mark it as bad or suspicious since it wasn’t involved in the incident.
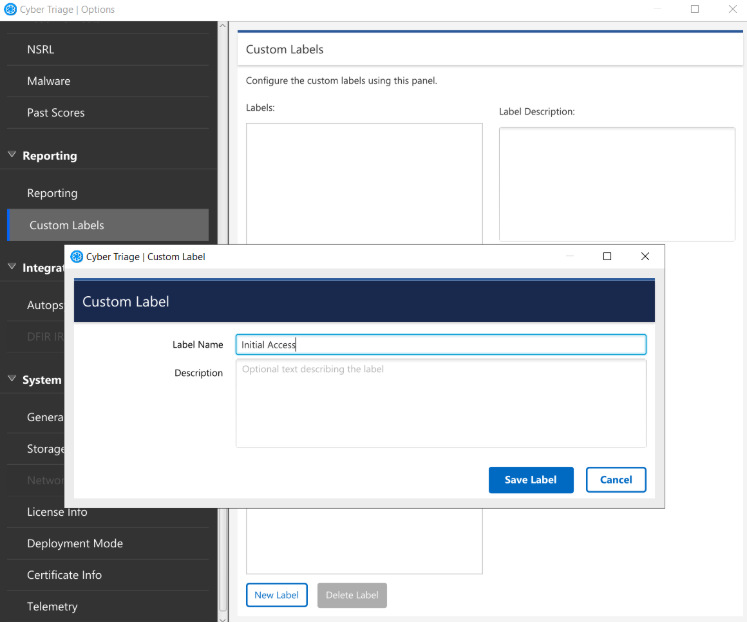
8.2.5.2. Adding a Label
Before you can add label to an item, you must define the name name. To do so, go to Options panel and choose “Reporting” / “Custom Labels” tab. Pick “New Label”.
To add a label to an item, right click on it and choose “Add Label”.
8.2.5.3. Viewing Labels
You can see the effect of adding a label in several places:
The label names are added as a column in the Review Notable Items table
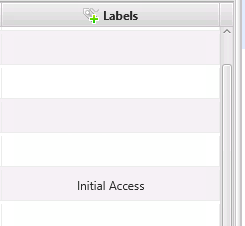
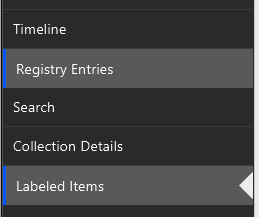
In the “Examine All Items” section, you can go to the “Labeled Items” view, found at the bottom of the left-hand navigation.
The labels are shown in the Excel report
The labeled items are shown in the “Notable Items” incident-level UI.
8.2.5.4. Removing a Label
You can remove a label from an item by right clicking on it and choosing “Remove Label”.
You can remove the label name from the system by going back to the Options panel. When it is removed from the Options panel, existing cases that use that label will continue to have it applied.
8.2.6. Scoring Keyboard Shortcuts
If you would rather not use the mouse and prefer keyboard shortcuts, you can also apply scores as follows:
Keyboard Shortcuts | |
|---|---|
Keys | Meaning |
SHIFT + B | Bad |
SHIFT + S | Suspicious |
SHIFT + G | Good |
SHIFT + U | Unknown |
SHIFT + C | Add Comment |
CTRL + Z | Undo |
8.3. Information Artifact Types
Cyber Triage organizes data into Information Artifacts, which are a higher-level concept than something like “Prefetch”. We put “Prefetch” artifacts under the “Process” information artifact because it represents that a process ran.
You’ll see references to the following information artifacts in the this manual.
- Users: Represents activity around user accounts
Accounts: What accounts existed on the host
Inbound Logons: Local and remote logins into the host
Outbound Logons: Hosts that the local user logged into from this host
Web Artifacts: Web browser activity from the users
Data Accessed: Files and documents opened by the user
- Processes: Represents activity around processes
Triggered Tasks: A configuration that will launch a process based on some trigger. Examples include RunOnce key, scheduled tasks, BITSJobs, etc.
Process: Evidence that a process ran. Either at the time of collection or from historical data like Prefetch or audit logs.
Active Network Connections: Network connections from a process to another host.
Listening Ports: Network ports that were opened by a process and are waiting for a connection.
- System Confirmation: Represents settings of the OS
OS Config Settings: Various settings of the OS that could impact audit logs or assisted in the attack.
Attached Devices: Shows what external devices were attached, such as USB drives.
More details can be found here
8.4. Summary Section
The goal of the Summary Section is for you to get an understanding of the host you are looking at. Every investigation is of course different, but the intention is that you spend five minutes or less here. You can dive into the details later.
There are several views within this section. The first set is about artifacts and what has been scored as bad:
Bad Items Timeline: Shows the timeline of what artifacts are scored as bad. Use this to get an idea of what timeframe is known about the attack.
ATT&CK Tactics: Shows the tactics associated with the bad items. Use this to get an idea of what stages of the attack are known.
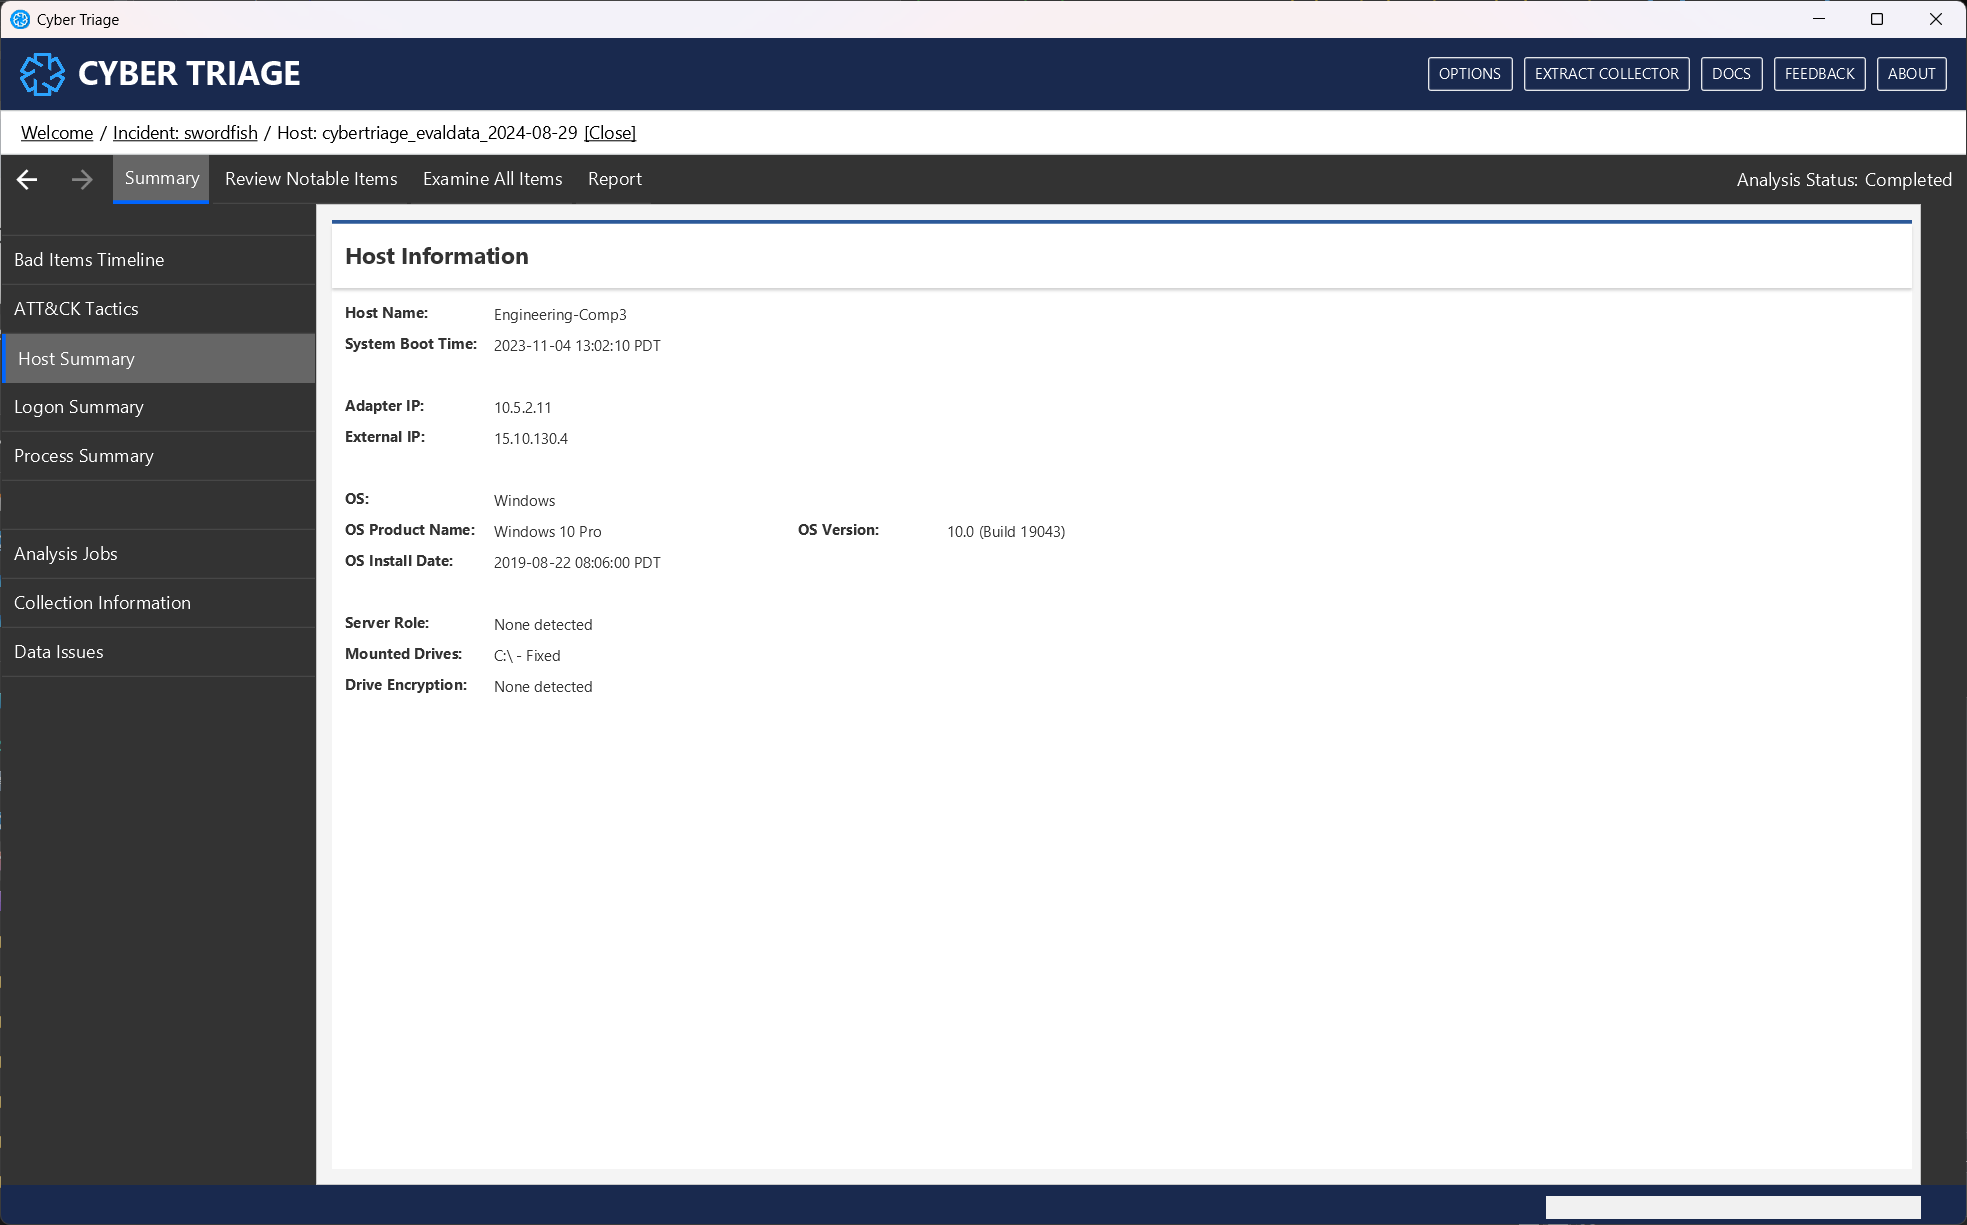
Host Summary: Shows key information associated with the operating system, host names, IPs, etc. Use this to get a basic idea of what kind of host you are looking at.
Logon Summary: Shows high-level information about inbound logins to the host. Use this to get a basic idea of who logs into the system and any users who recently started to login (if there is sufficient data).
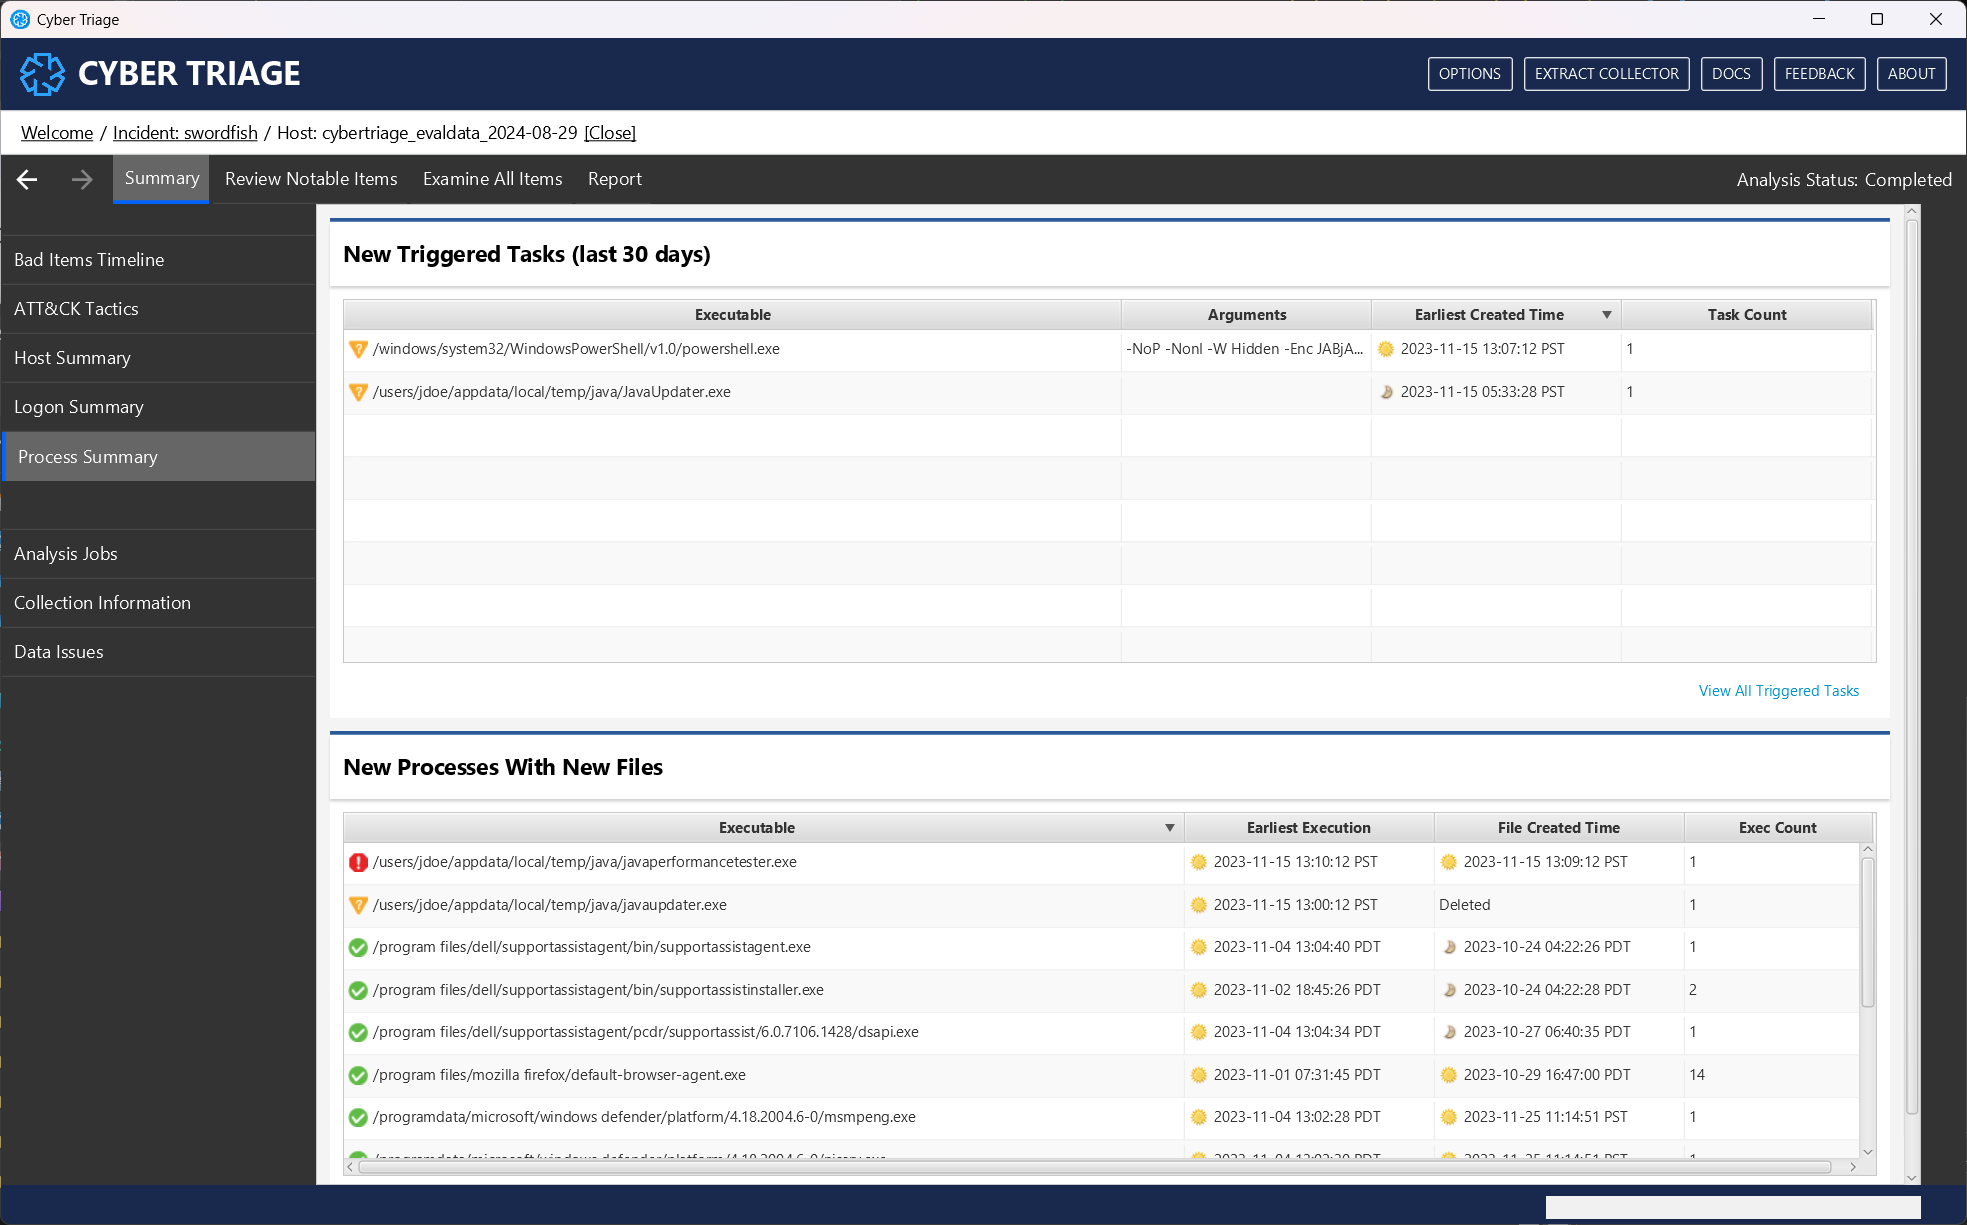
Process Summary: Shows high-level information about processes on the host. If there is sufficient historical information, you’ll see what new processes started to run and new Triggered Tasks. Use this data to see if there was any recent change in activity. The “New Processes with New Files” section will show only processes that ran for the first time in the past 30 days and has an executable that was created in the past 30 days.
The second set of views is about the collection and analysis pipelines. You won’t learn about specific artifacts here, but they give you an overview of the analysis:
Analysis Jobs: This will show you what analysis is still ongoing. You can cancel jobs from here.
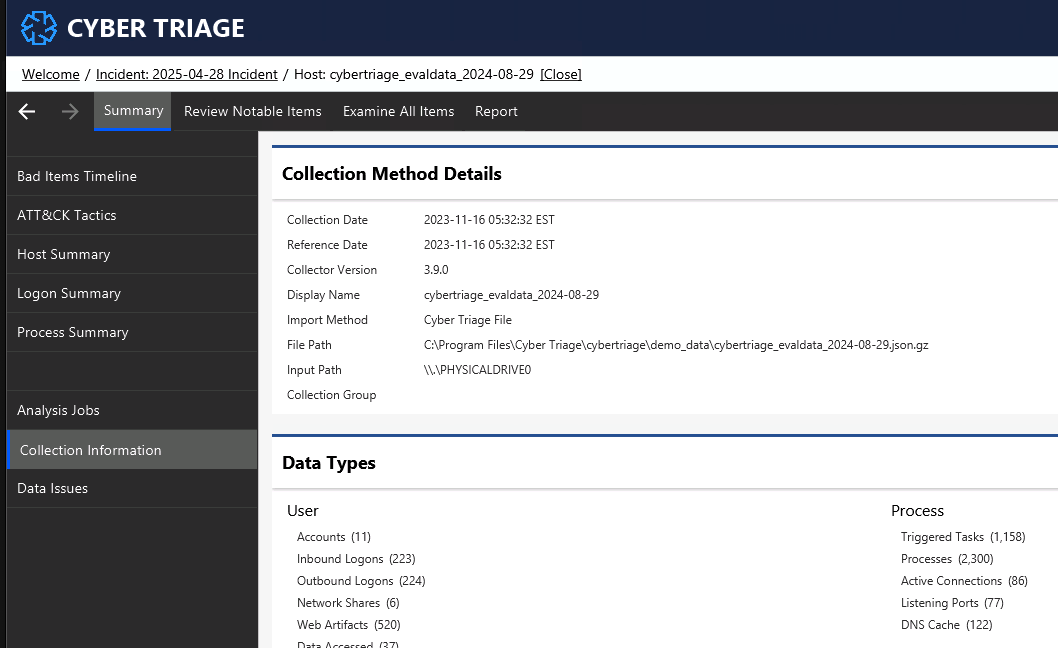
- Collection Information: This will show you how the data was collected and what was collected.
The “Source Files” section will list all files that were attempted to be collected (even if they didn’t exist). The Status column will show you if it was attempted and found. You can export all of the collected files with the “Export All Collected Source Files” option.
Data Issues: This will show you any errors associated with the collection or processing of the data.
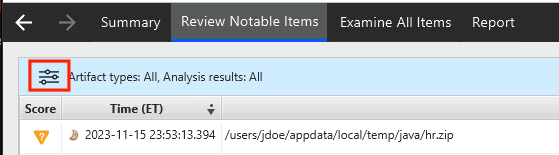
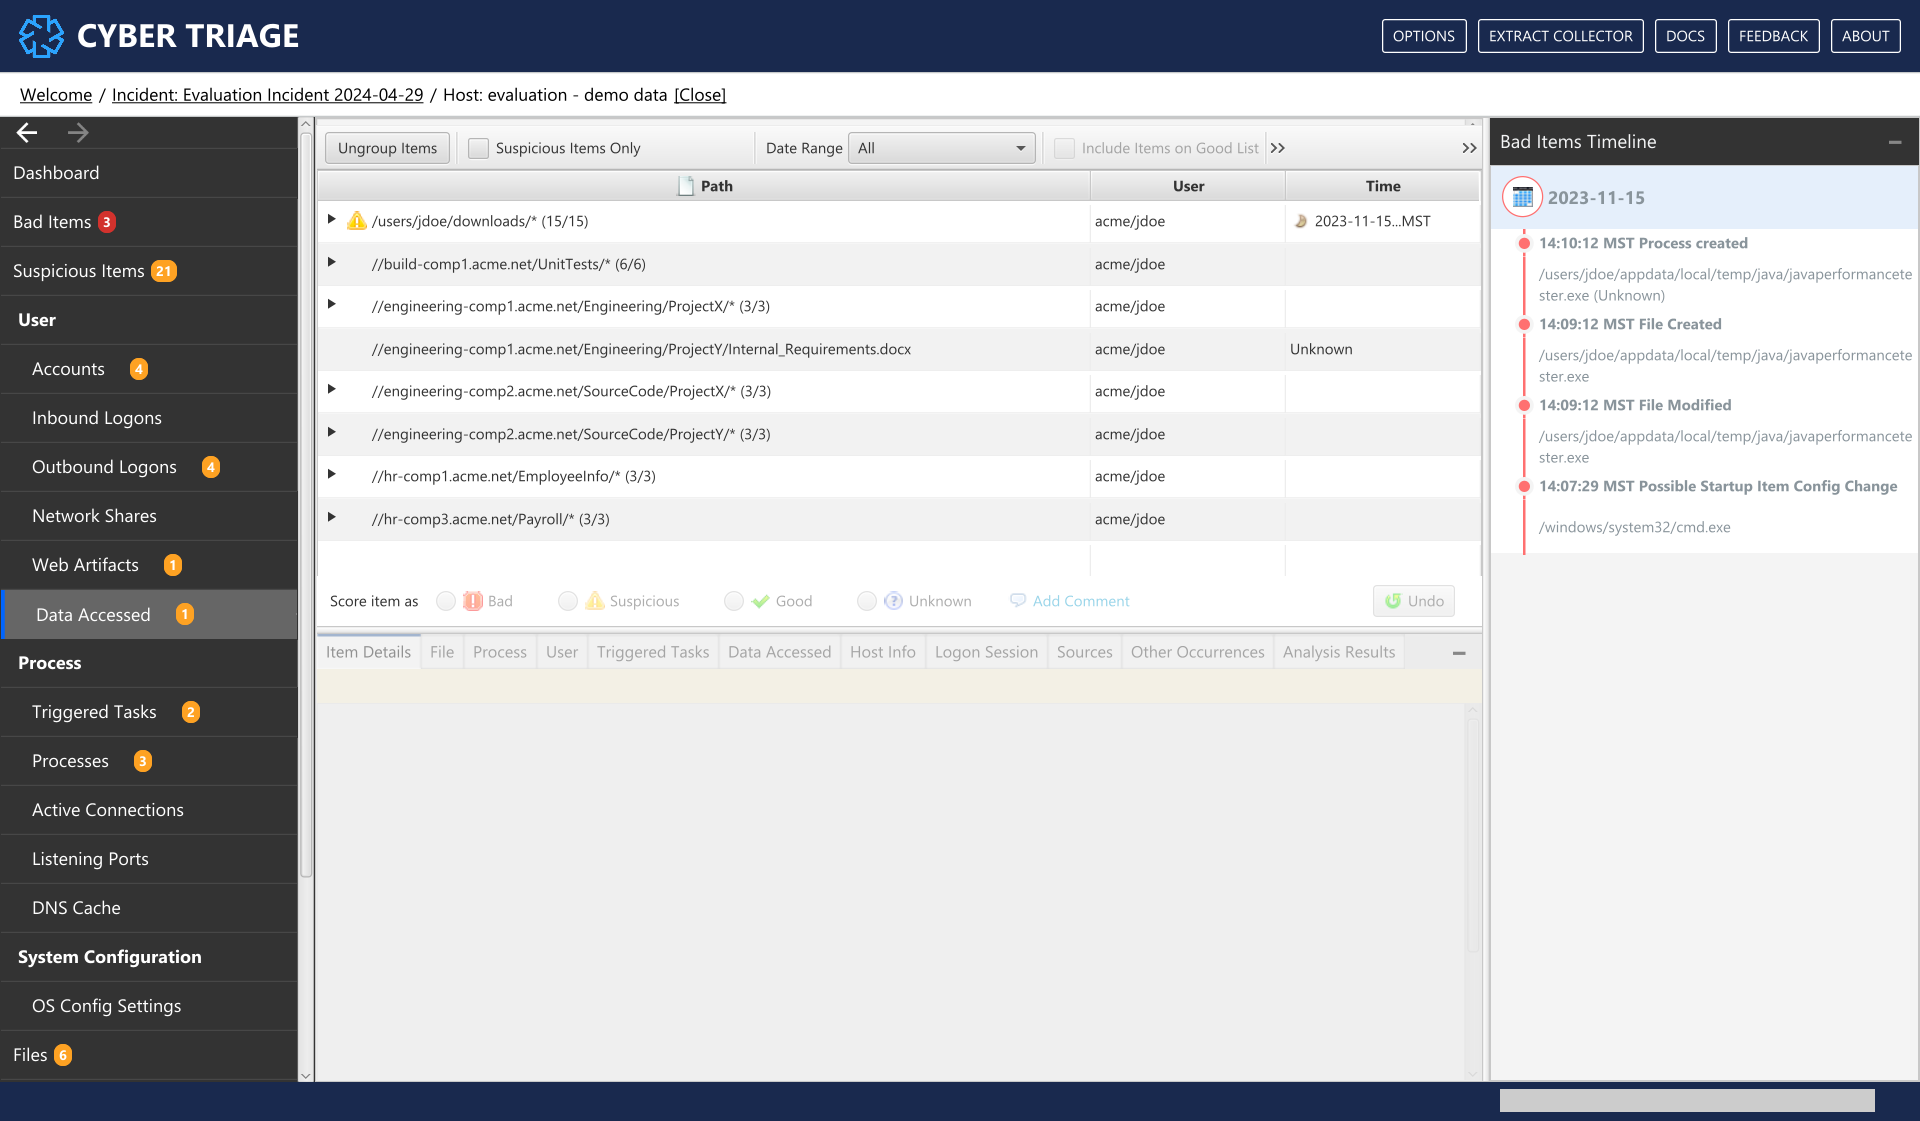
8.5. Review Notable Items Section
Once you have used the Summary section to get an understanding of the system, you should move to the “Review Notable Items section. The goals of this section are to:
Confirm if the automatically scored Bad and Suspicious items are Bad or if they were false positives
Get an understanding of the sequence of events. This data is displayed in a timeline view.
You may spend most of your investigation time in this section.
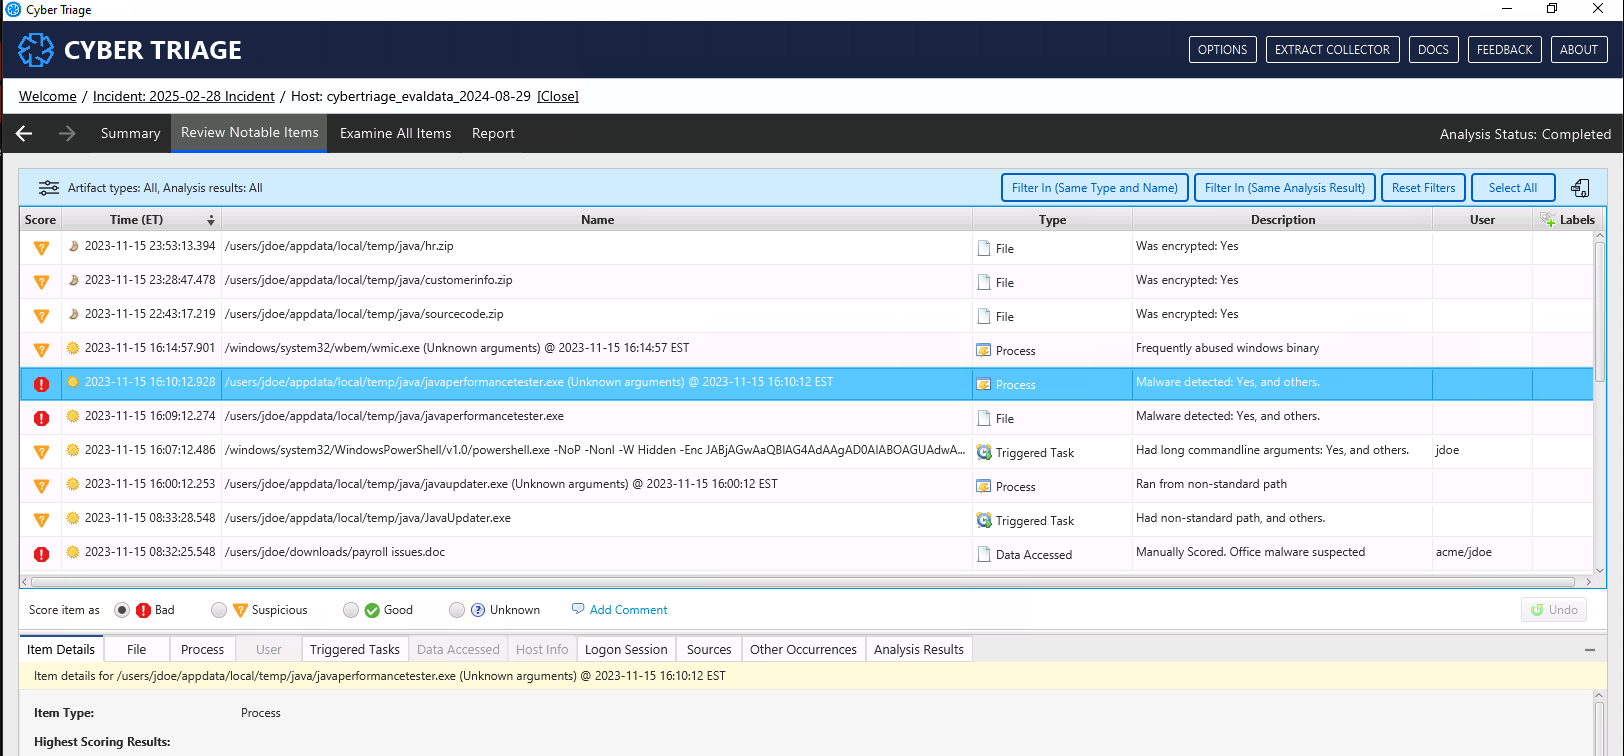
By default, you will see all items scored as Bad and Suspicious, sorted by time. The suggested process is to:
- Go down the list and review each item.
If it’s an obvious false positive, then change the score to “Unknown” or “Good”. If you known it is Good, you can also optionally add it to the “Good List” by right clicking on it.
If it was scored as suspicious and is obviously bad, then change it’s score to “Bad”.
If it’s not obvious, then skip it and come back to it.
After doing a first pass on all of the automatically scored items, then revisit each of the more complicated ones and make decisions about them. Change their score appropriately.
You can of course fully analyze each item before moving on to the next. We suggest the breadth-first approach to first get a full understanding of what was found.
Your goal is to change all of the suspicious items to Bad, Good, or Unknown.
You can use filters using the icon in the upper right to focus on specific types of items:
8.6. Further Investigating An Item
When you want to better understand an item, there are several techniques you can use:
Review associated items using the bottom “Related Items” viewers
Submit executables for sandbox analysis
Export files for 3rd party analysis
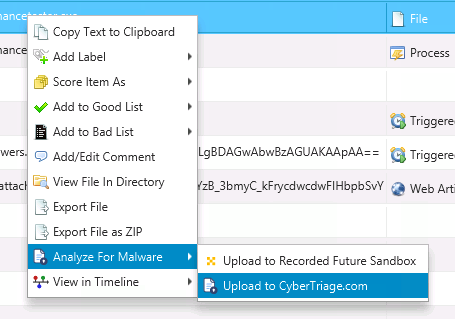
8.6.2. Upload for Sandbox Analysis from Recorded Future
If you have a suspicious executable or document, you can also upload it to the Recorded Future Sandbox so that you can get dynamic analysis. The file will be run on a remote system (managed by Recorded Future) and you will get a report of what processes were created, files opened, etc.
Note
Any file submitted to Recorded Future for analysis will not be available to the public and will remain in the Cyber Triage® Recorded Future enclave.
To use this feature:
Right-click on a file and select “Analyze for Malware” and then “Upload to Recorded Future Sandbox”
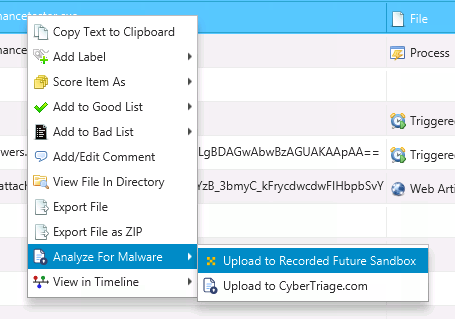
Right-Click on File and select Submit to Recorded Future Sandbox
Agree to the Recorded Future Sandbox Privacy Agreement
Wait a few minutes for the program to run in their controlled environment
Click the “Details” link next to Online File Reputation section on the main Dashboard.
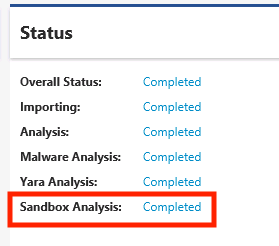
Click the “Details” link next to Online File Reputation section on the main Dashboard
And then select the uploaded file to see the behavior analysis
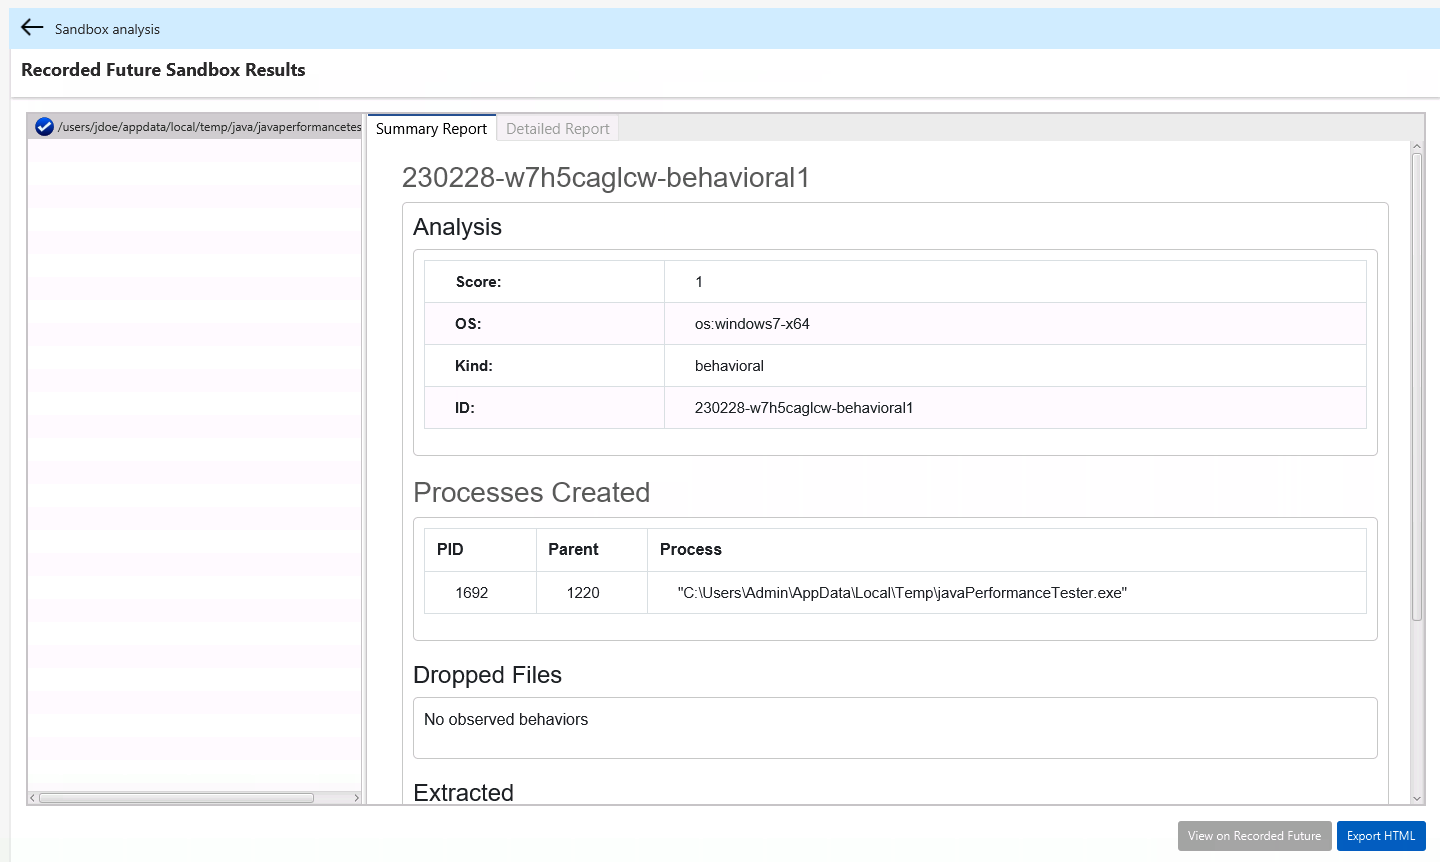
Viewing your report “Recorded Future Sandbox Results” tab in the File Reputation Service Status panel
The “Detailed Report” tab will sometimes show additional information from the sandbox run than what is found on the summary. This report is the original one from Recorded Future.
8.6.3. Upload File Content for Malware Analysis
If you chose to not upload content for malware analysis during automated analysis, you can later upload specific files by right clicking on them and choosing “Upload to CyberTriage.com”.
Once the results come back, the score will automatically change.
8.6.4. Export Files
You may want to export files from Cyber Triage so that you can share them or analyze them in other tools. You have two ways of doing this depending on what kind of file it is.
If you want to extract a single file or folder that you found from one of the data types or file explorer, then simply right click and you’ll see two “Export File” options.
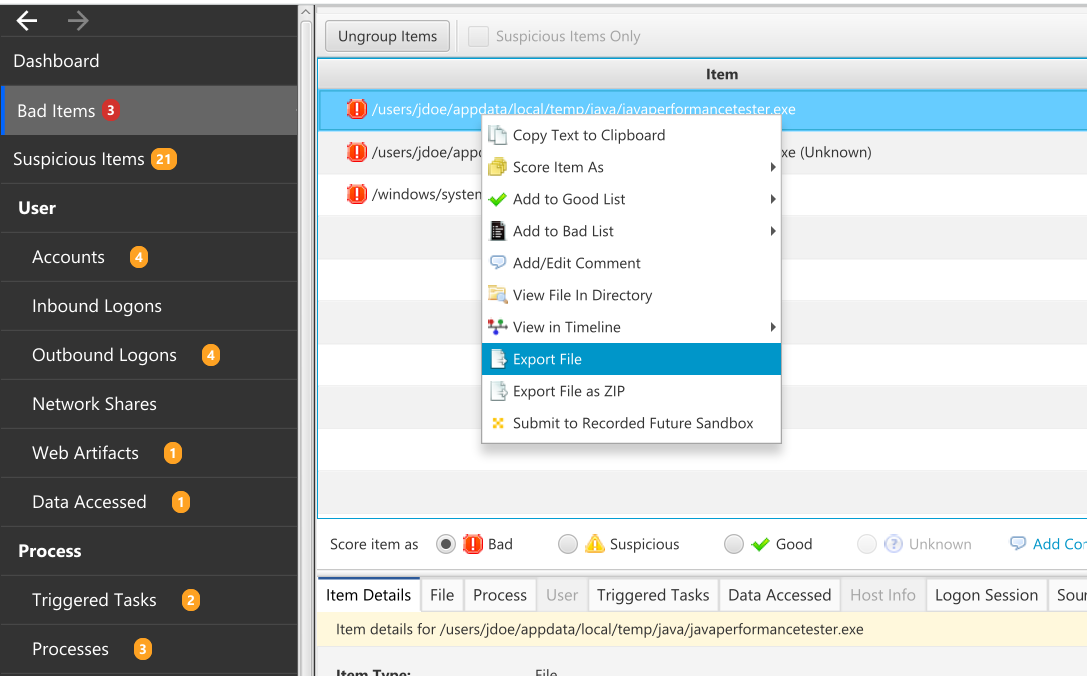
Right-Click to Export Files
The “Export File” will save the file in its original form. The “Export File as ZIP” will place the file into a ZIP file with the password “infected” (without the quotes). The ZIP file is useful to prevent malware from being quarantined or deleted.
If you want to export all source files (such as registry hives, event logs, prefetch files, etc.), then go to the Summary / Collection Information panel. See Summary Section.
8.7. Examine All Items Section
Lastly, you can review all of the artifacts, not just the ones that were scored as suspicious or bad. You can do this in the “Examine All Items” section. Sometimes, you may not even need to come in this section if enough was found from the automated analysis.
The information artifact types on the left hand side are organized by user-oriented data and process-oriented data.
8.7.1. Accounts
The Accounts menu item shows all local and domain user accounts that either:
Have accounts on the host
Logged into the host
Are referenced in log files
This means that depending on the filter settings, you will see accounts that did not log into the system. You can use the filters to focus in on different types of users.
Note
Not all data will be available for all users in this view because some data exists only for local accounts and other data is from logs that roll over.
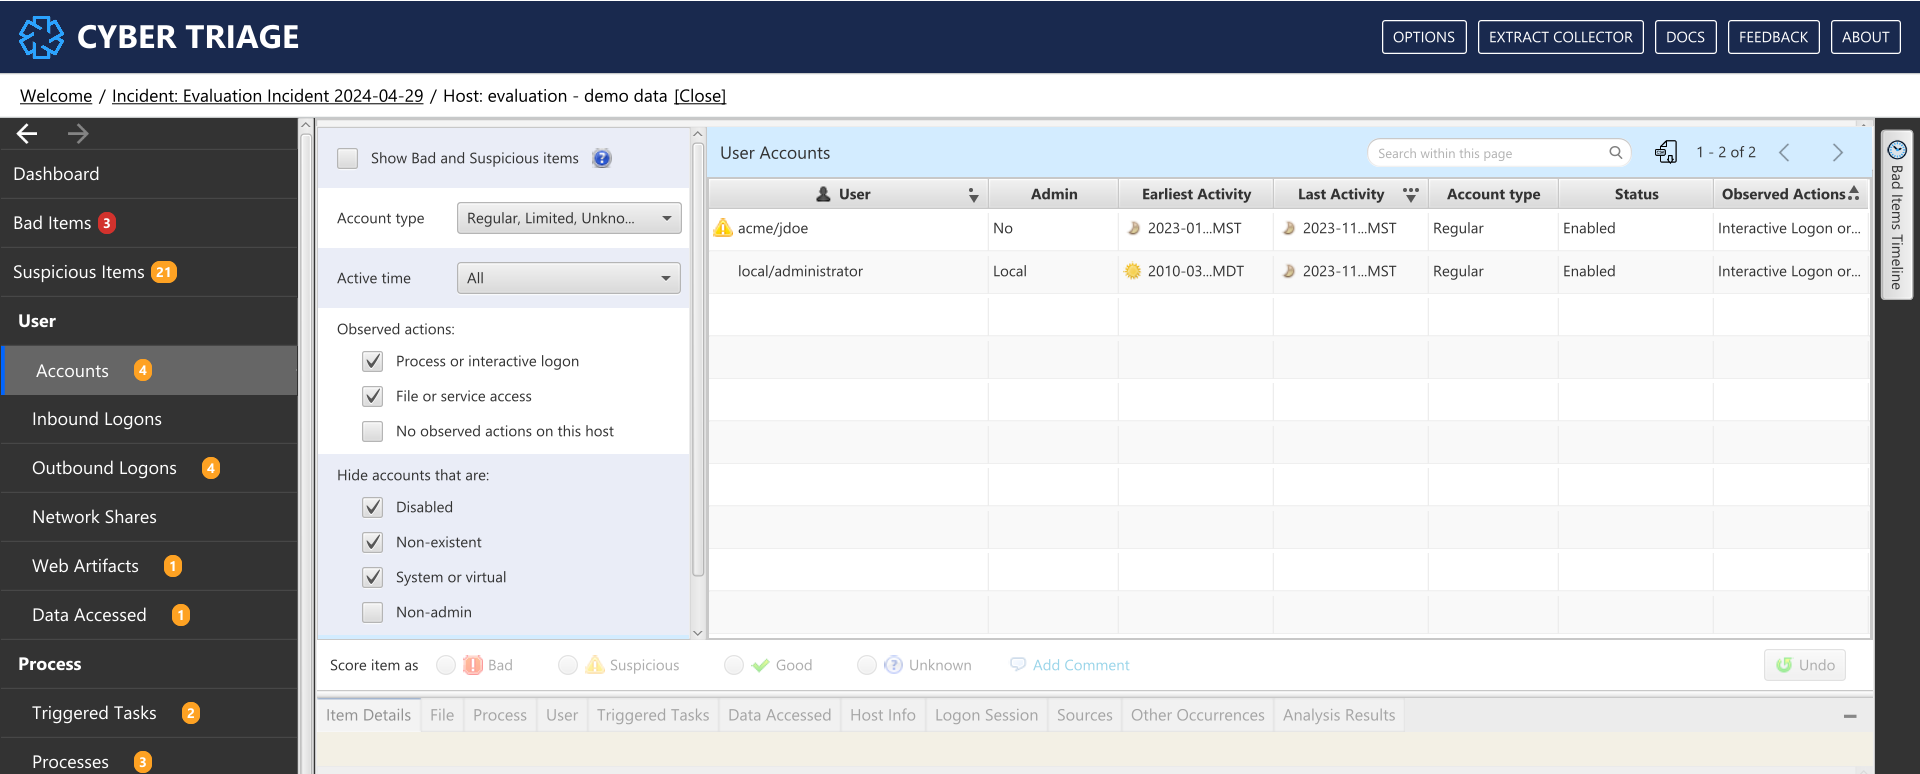
Accounts Interface
What Should You Do: Review the accounts to identify those with an abnormal naming convention, in appropriate permissions, or creation times that are similar to the incident timing.
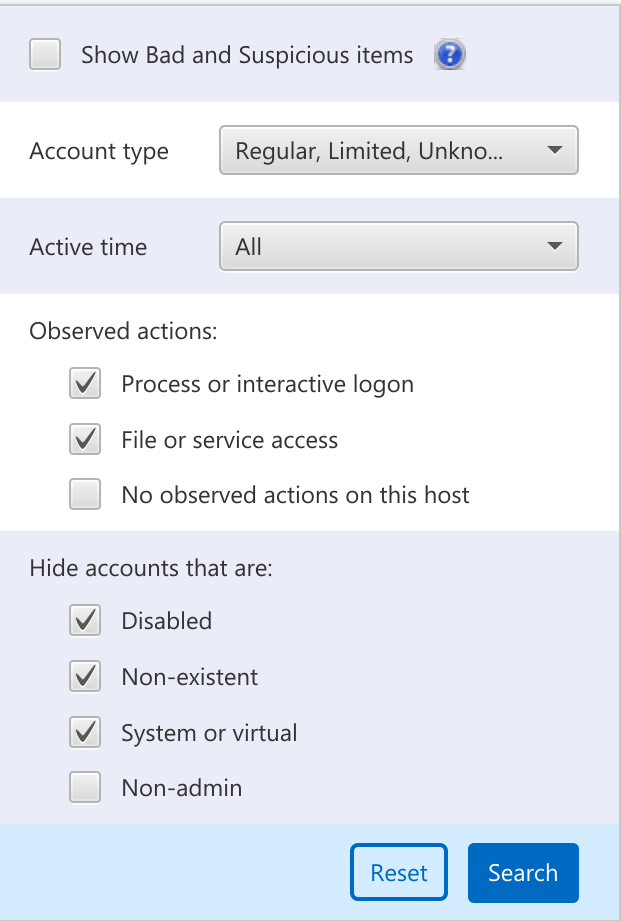
The following filters exist in this view:
Show all bad and suspicious items: This option will show only accounts that have been scored as suspicious or bad.
- Account Type: Select what types of accounts to include in the view:
Regular: Accounts that currently exist on the system. Pulled from SAM and Software hives.
Service: A Windows service account
Limited: A Windows limited access user account, such as Guest.
Unknown: Accounts for which a reference was found (either by SID or user name), but do not map back to registry data for a Regular, Service, or Limited account. This can be a deleted “regular” account or a reference to a user that may not even exist on the system, such as the destination user for an outgoing logon session.
Active Time: Date range that the user had activity
- Observed Actions: Select what kind of activity that the account must have:
Process or interactive logon: Accounts for which there is evidence that the user had a local or remote interactive login with the system or launched a process (locally or remotely) on the system.
File or service access: Accounts for which there is evidence that the user interacted with a file or service on the system. Examples include accessing a file share or owning a file that got copied to the system.
No observed actions: Accounts where there was a reference to the user on the system, perhaps in an event log or registry, but no evidence was found of them doing anything on this specific system. Examples include accounts that were created and never used or entries in a log server.
- Hide accounts: Select what kinds of accounts that you do not want to view, often because they are not typically interesting during an intrusion:
Disabled: Accounts that are not active (and therefore can’t be used).
Non-existent: Incorrect user names that were used for attempted logons.
System or virtual: Accounts that are created by the OS (such as ‘Font Driver Host/DWM-1’).
Non-admin: Accounts that have normal user access.
Domain controllers require special attention if you want to know who logged into it because every user in the domain will have some kind of reference on it (from accessing a file share or using the controller for authentication). Filter on accounts that had Interactive Actions to focus on the accounts that logged in.
8.7.2. Inbound Logons
Note
As of version 3.4.0, the “Logins” section has been replaced by the new “Inbound Logons” and “Outbound Logons” sections.
This menu item shows the local interactive, inbound interactive, and network logons onto the system. They are grouped together to show you when the system was being used, regardless of how the user got onto the system.
Cyber Triage merges together from multiple sources to provide these sessions. For example, it will parse events from the Security and Terminal Services log to identify events that correspond to the same time when a user logged in and show them to you as a single session. The various places that were used to determine a session can be found in the Sources tab.
You should review this data to look for sessions with suspicious locations or users. Remote logons are used to move laterally within corporate environments and to launch programs.
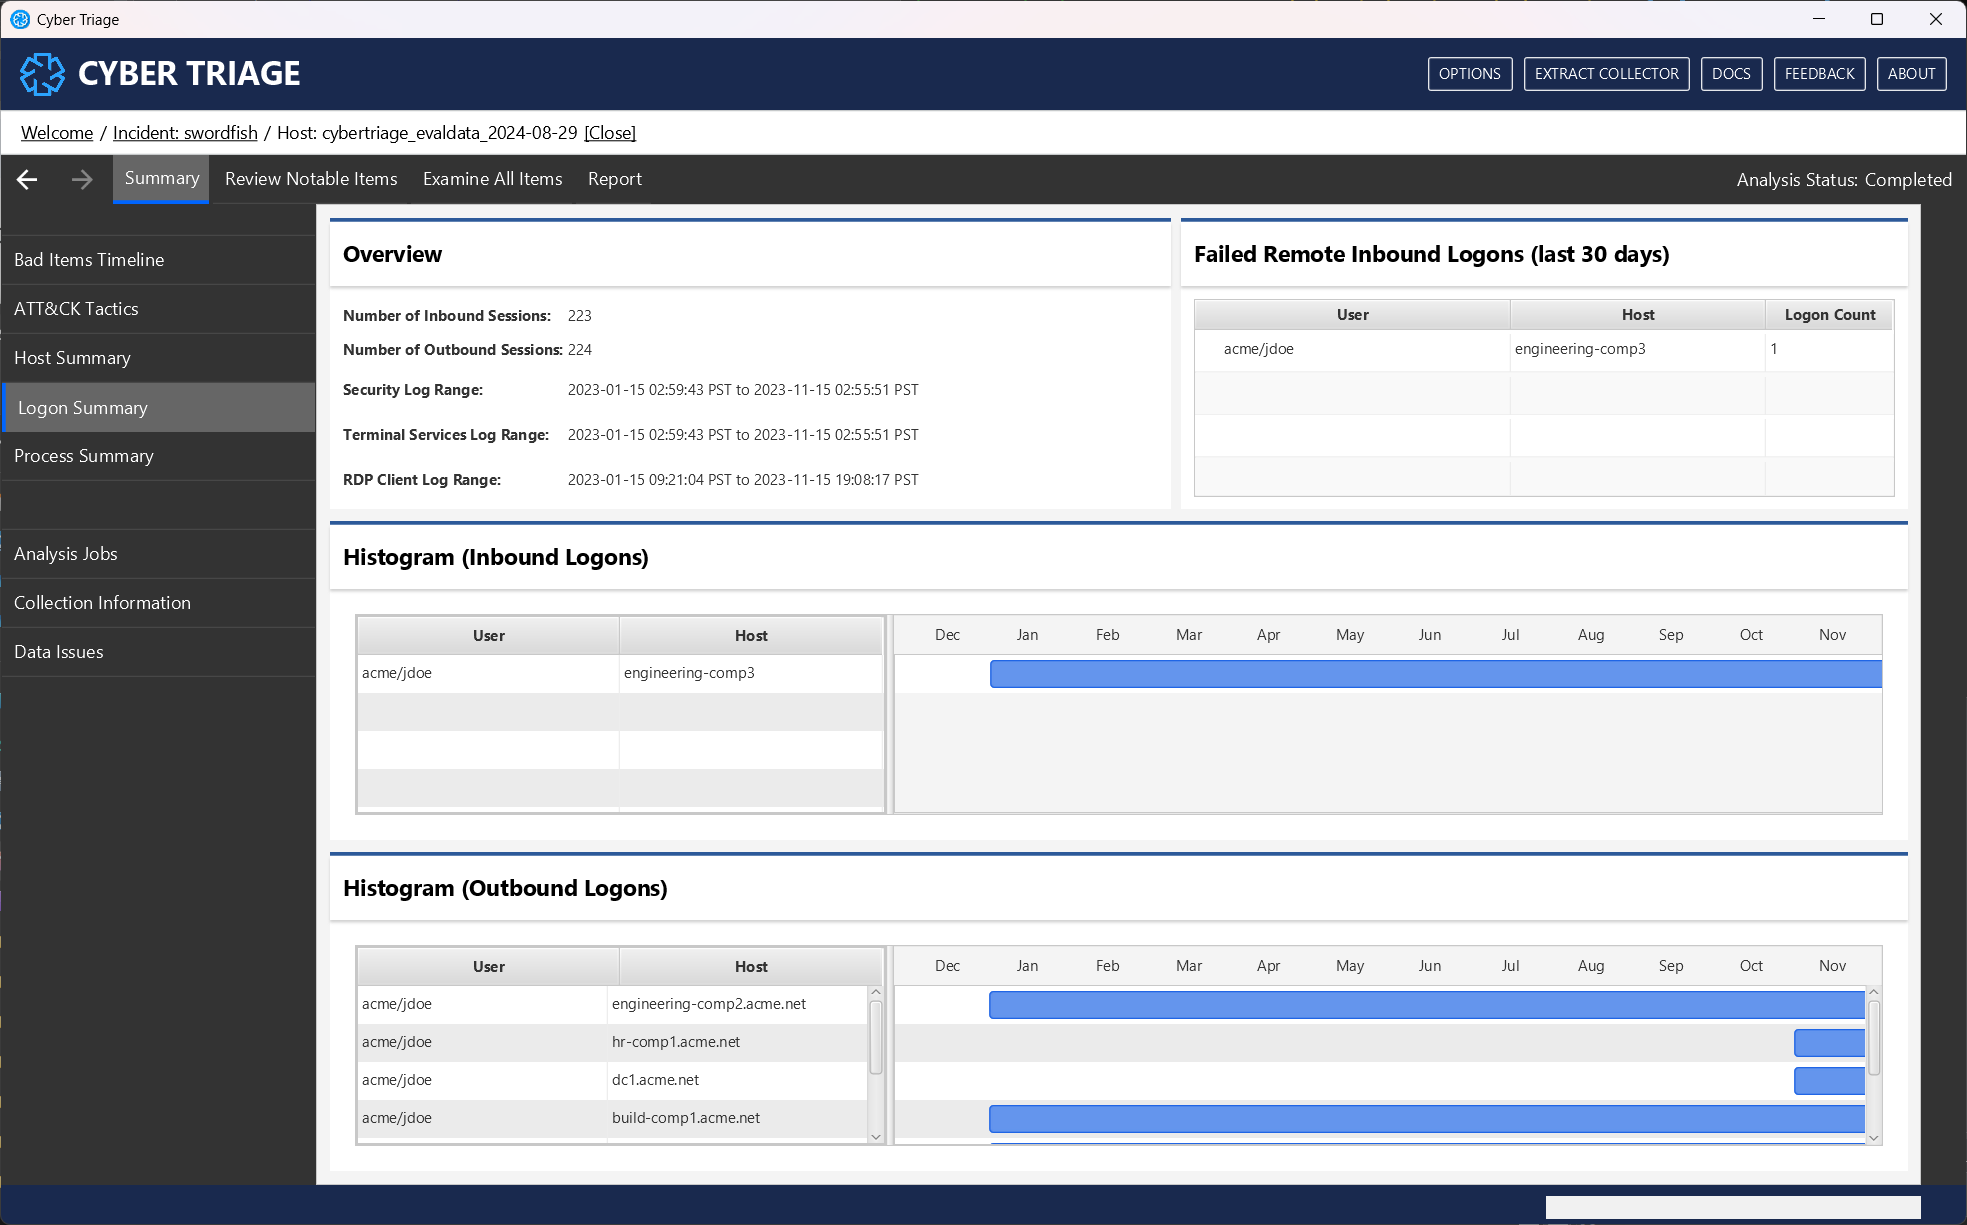
8.7.2.1. Inbound Logon Summary Panel
When you first open this section, you’ll see a summary panel that can help you focus on certain types of data.
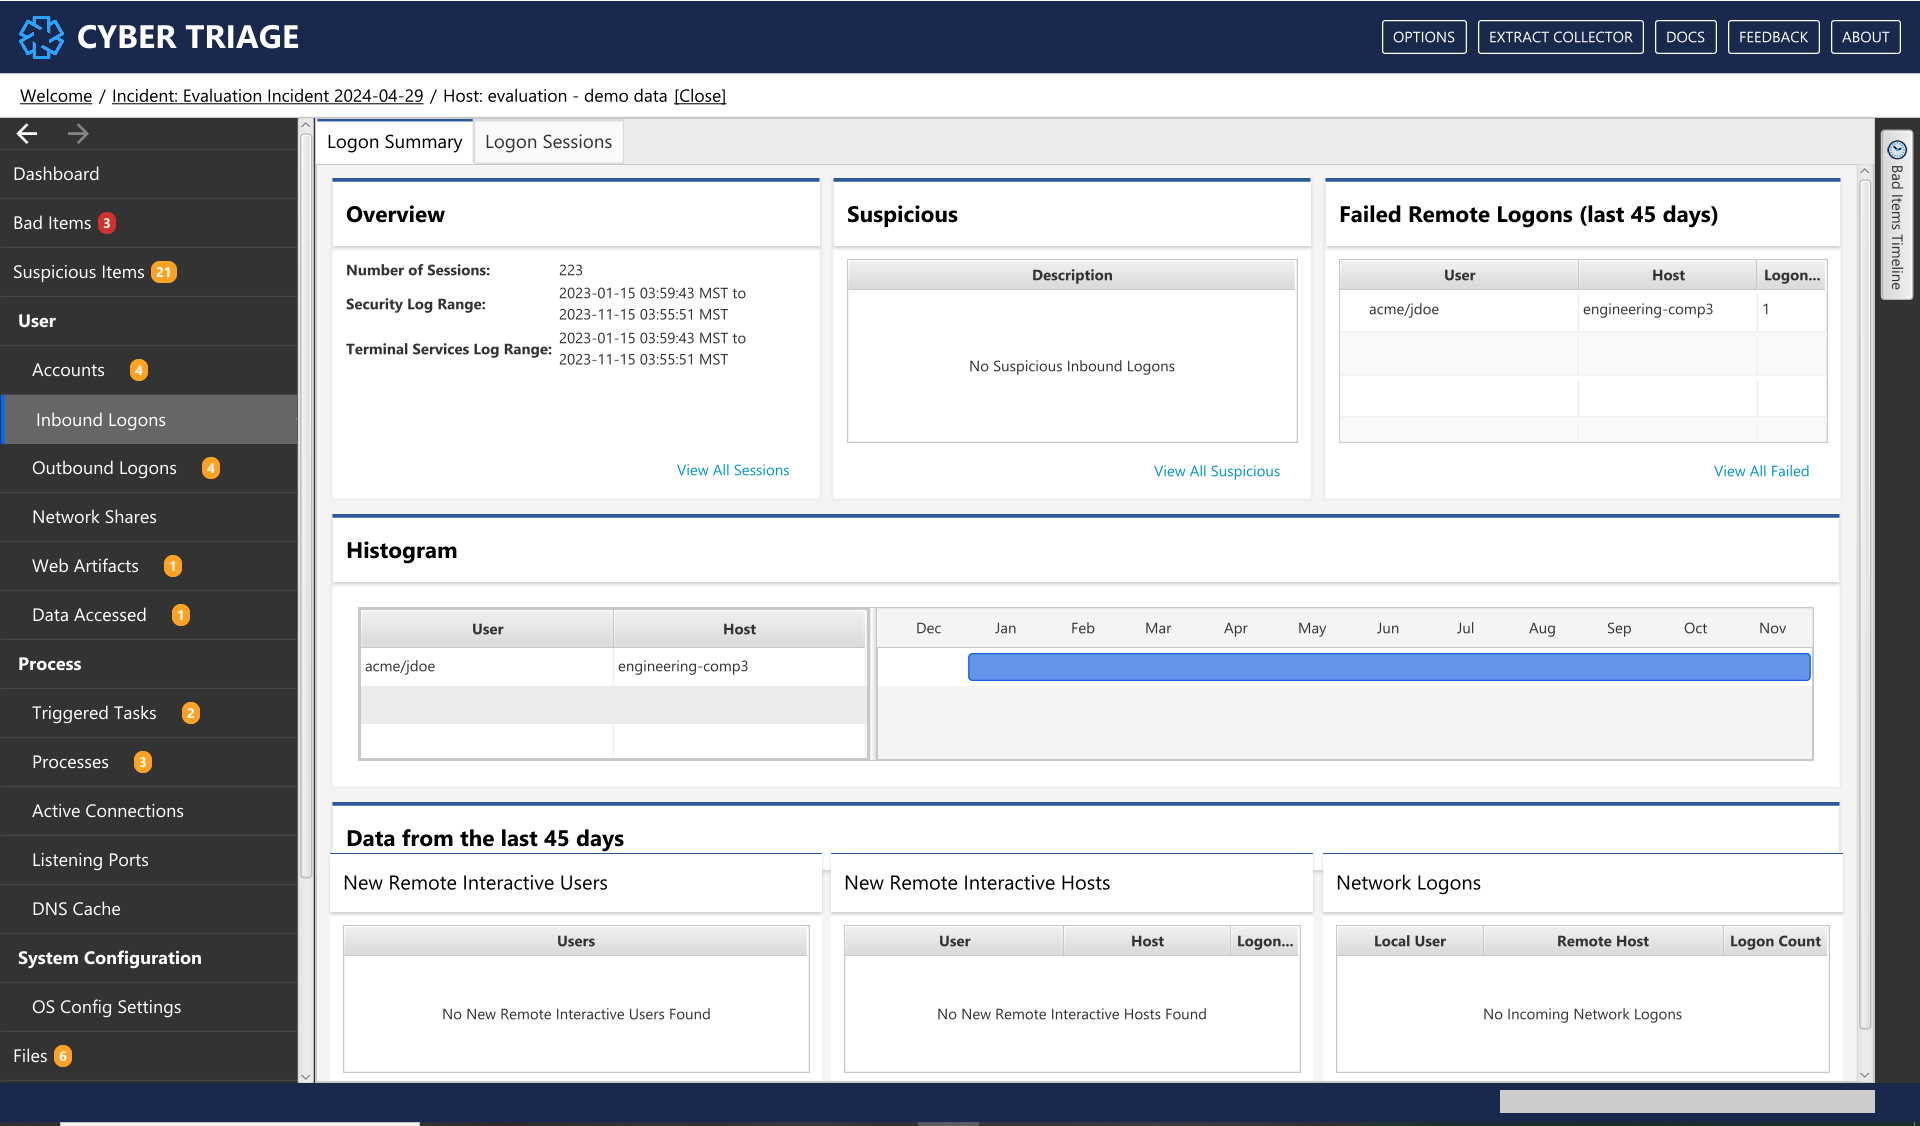
Inbound Logons Summary Interface
The Overview section gives you an overview of what kind of logon data exists. It gives the number of sessions and date ranges that were found in various logs. This will give you some idea about how much historical data you’ll be seeing.
The Suspicious section will give you the unique descriptions of why logons were scored as suspicious.
The Recent Failed Logons section will show you which remote interactive logons were recently failed. This can be helpful to look for password attacks.
The Histogram section shows you which users logged in and from where for the last 12 months of the system (if there is enough data). For accounts that logged in within the past two months, it will also show what host was used. The term “Various” in the host column means that multiple hosts were merged into a single row.
- The bottom part of the UI will show an overview of possibly interesting data from the last 45 days of the system:
The New Interactive Users section shows users who logged in for the first time using a remote interactive session. This could be from an attacker who used compromised credentials to log into this system. Or, it could be a new employee or a change in job responsibility.
The New Interactive Hosts (Old Users) section shows which hosts that existing users started to use. For example, if user ‘jdoe’ has used a computer for 1-year, then they will only show up in this table if they start to come in from a new IP/host. This could be a sign that the user’s account is compromised and the attacker is coming in from atypical locations. Or, it could be that a user comes in from different IPs based on VPN or DHCP.
The Network Logons section shows all of the recent, unique network logons (i.e. that are not interactive). These happen when a remote user mounts a file share, uses a tool like PsExec, and various other methods. There are some routine IT network logons and this data should be reviewed to look for unexpected combinations.
8.7.2.2. Inbound Logon Search Panel
The second tab allows you to search for logon sessions. By default, all logon sessions are shown and grouped by unique combinations of local user and source host (“local” is used for local interactive logons).
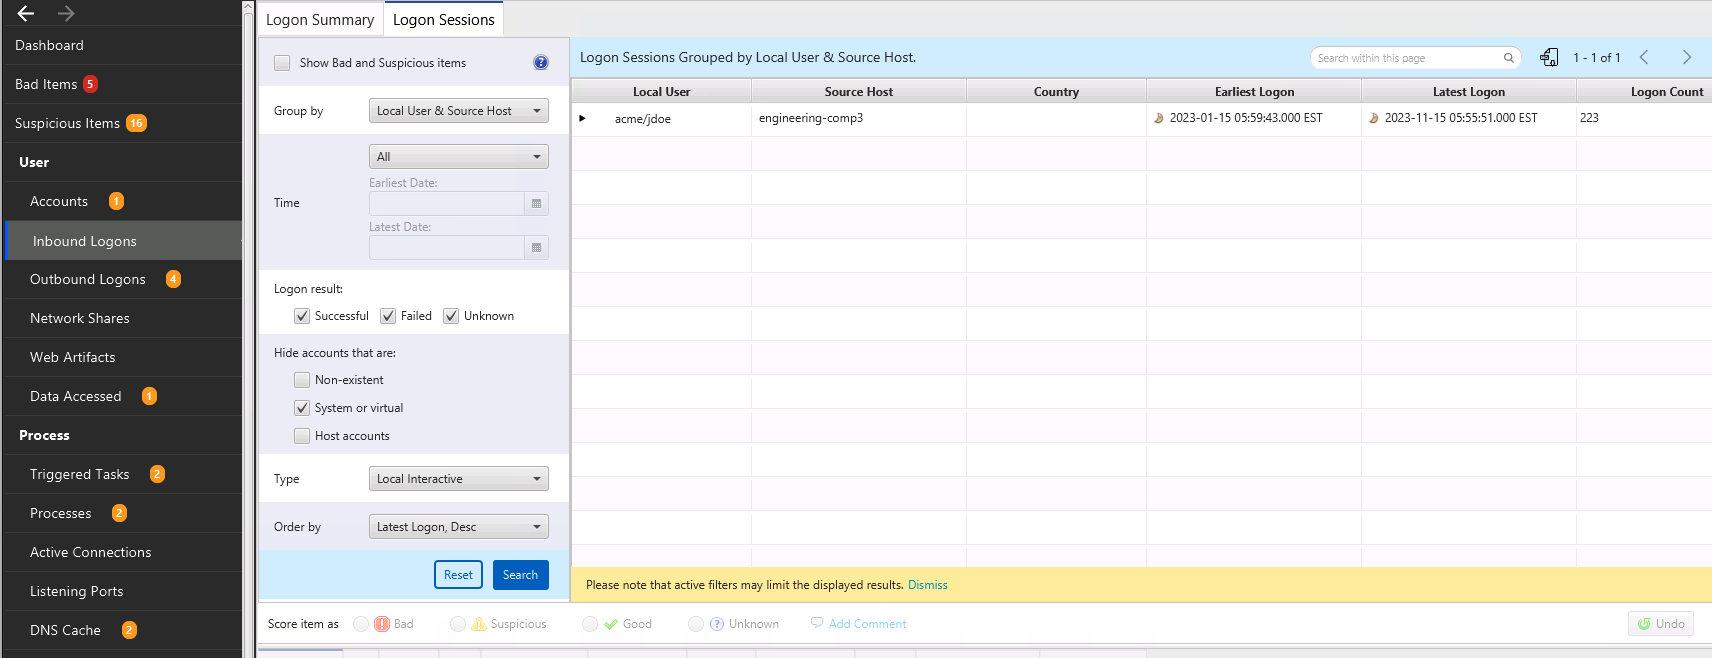
Inbound Logons Interface
You can change the search criteria to focus on time ranges or types of logons. The following filters exist:
Show all suspicious items will show only logons that are scored as suspicious.
Group by will allow you to group the hundreds or thousands of sessions so that you can identify anomalous combinations of hosts and users. By default, the sessions are grouped by remote host and local user, but you can focus instead only on local users or on remote hosts.
Time will allow you to focus on sessions that occurred within the time range. This allows you to, for example, ignore sessions that happened a year ago.
Logon result will allow you to only focus in on failed logons or to ignore them if they are a lot of noise.
Type will allow you to focus on only local logons, remote interactive, or network logons. By default, all three are shown.
Order By allows you to specify how the groups are sorted. By default, it shows the most recent logons first, but you can also order by host, etc.
You can select a group and then see individual sessions. Selecting a session allows you to see details on the bottom about the user and hosts.
What Should You Do: Review this data to look for suspicious hosts, users, and times. Cyber Triage® may mark some of them as being suspicious and you should review those and others to identify them as Good or Bad.
8.7.2.3. Logon Info Panel Tabs
Once an incoming/outgoing logon is selected, you can view more information about that logon in the Logon Info Panel and the related tabs shown below.
This tab shows related logon sessions.
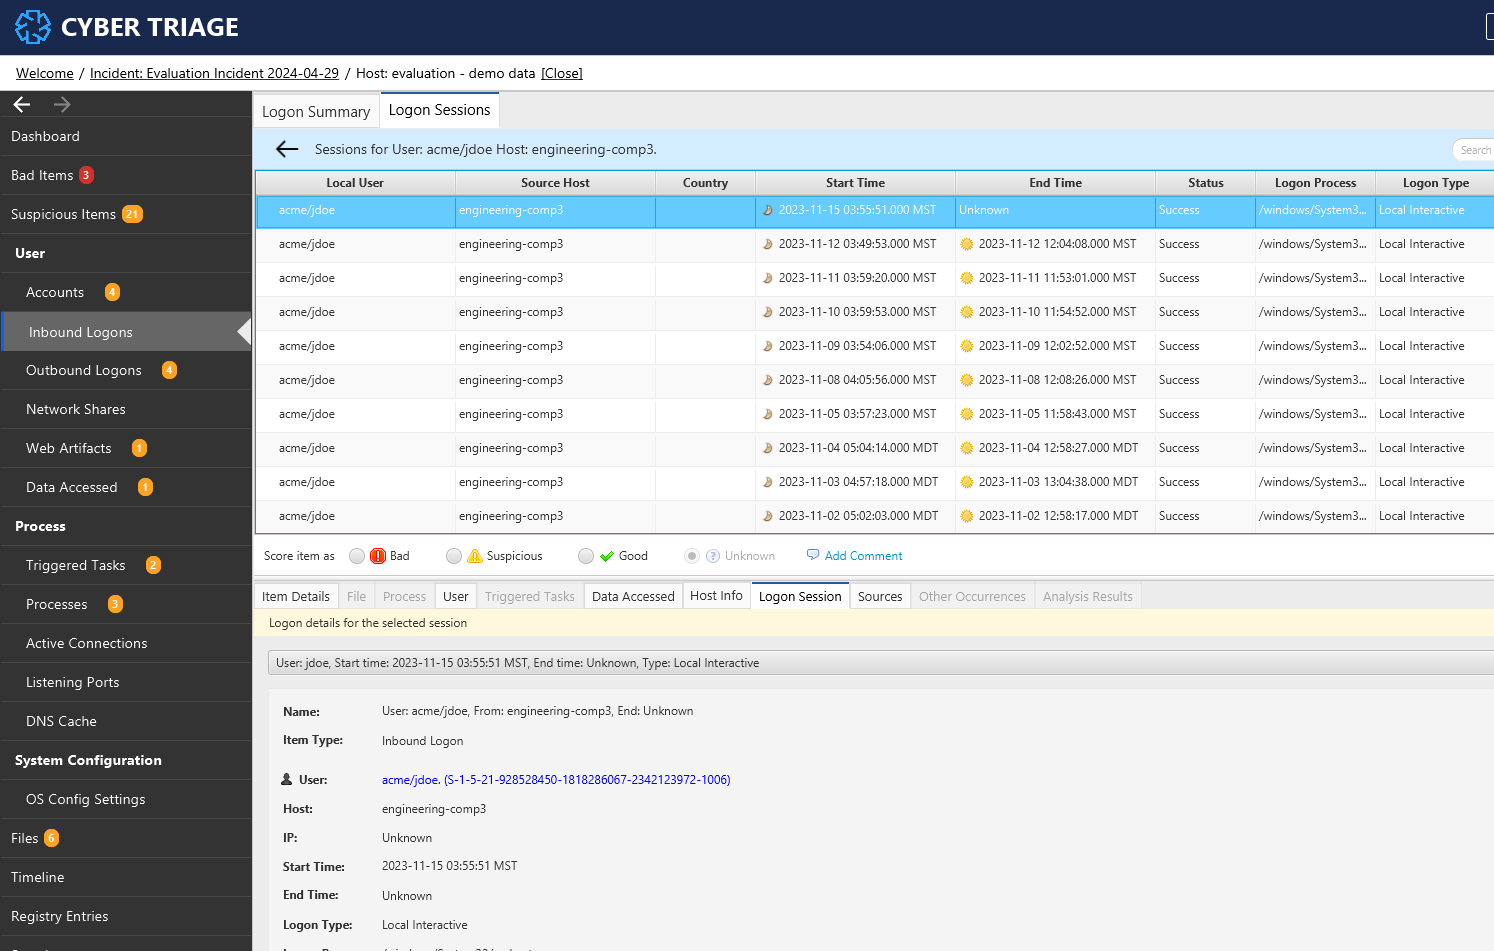
Logon Info Panel - Related Login Session Tab
The “Sources” tab will show from which artifact we pulled any logon data associated with a particular logon session.
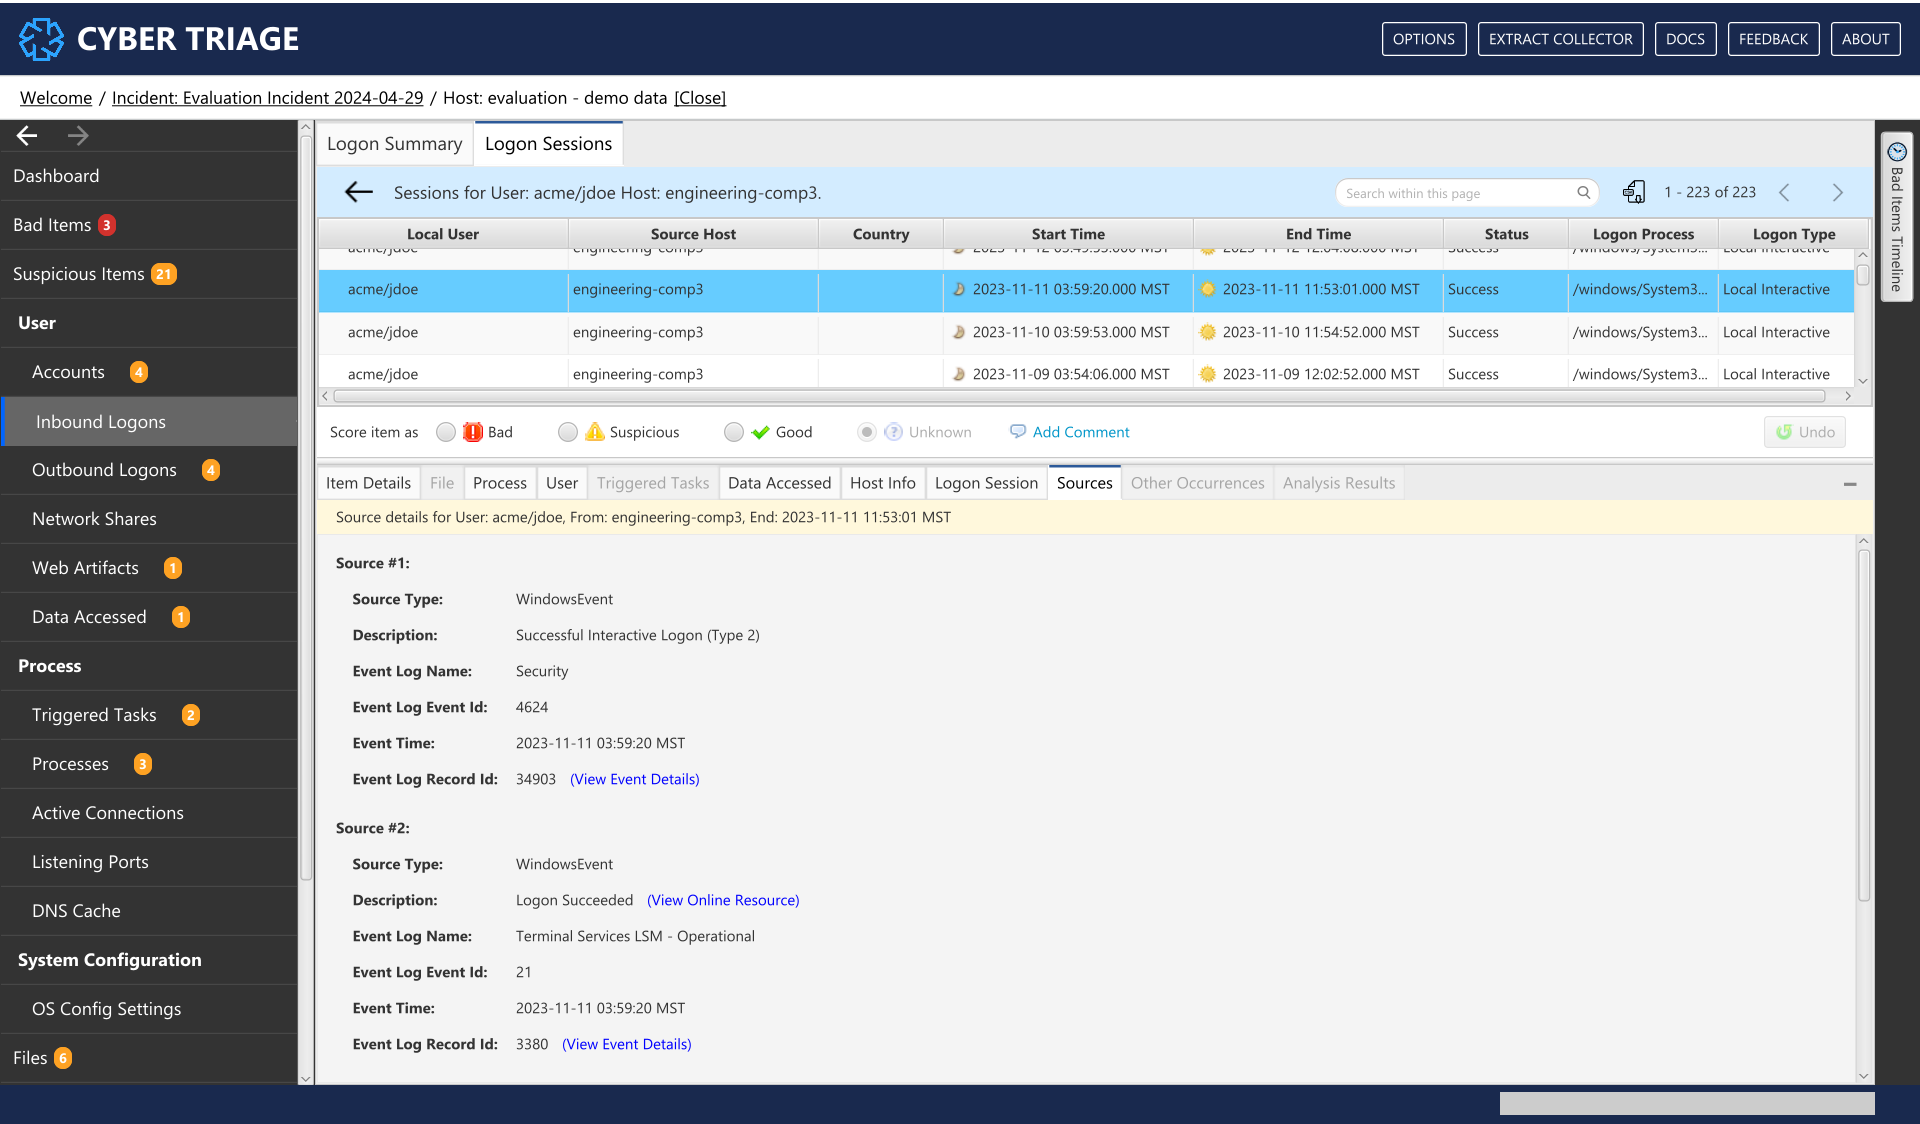
Logon Info Panel - Related Login Session Tab
8.7.3. Outbound Logons
The same panels are present for Outbound Logons. The Outbound Logon menu item shows logons that local users made to other systems. This data often does not have all logons, but may have data from applications that save which hosts were used and from some event logs.
8.7.3.1. Outbound Logon Summary Panel
Like the Inbound Logon section, this area starts off with a summary panel to show recent destinations and users.
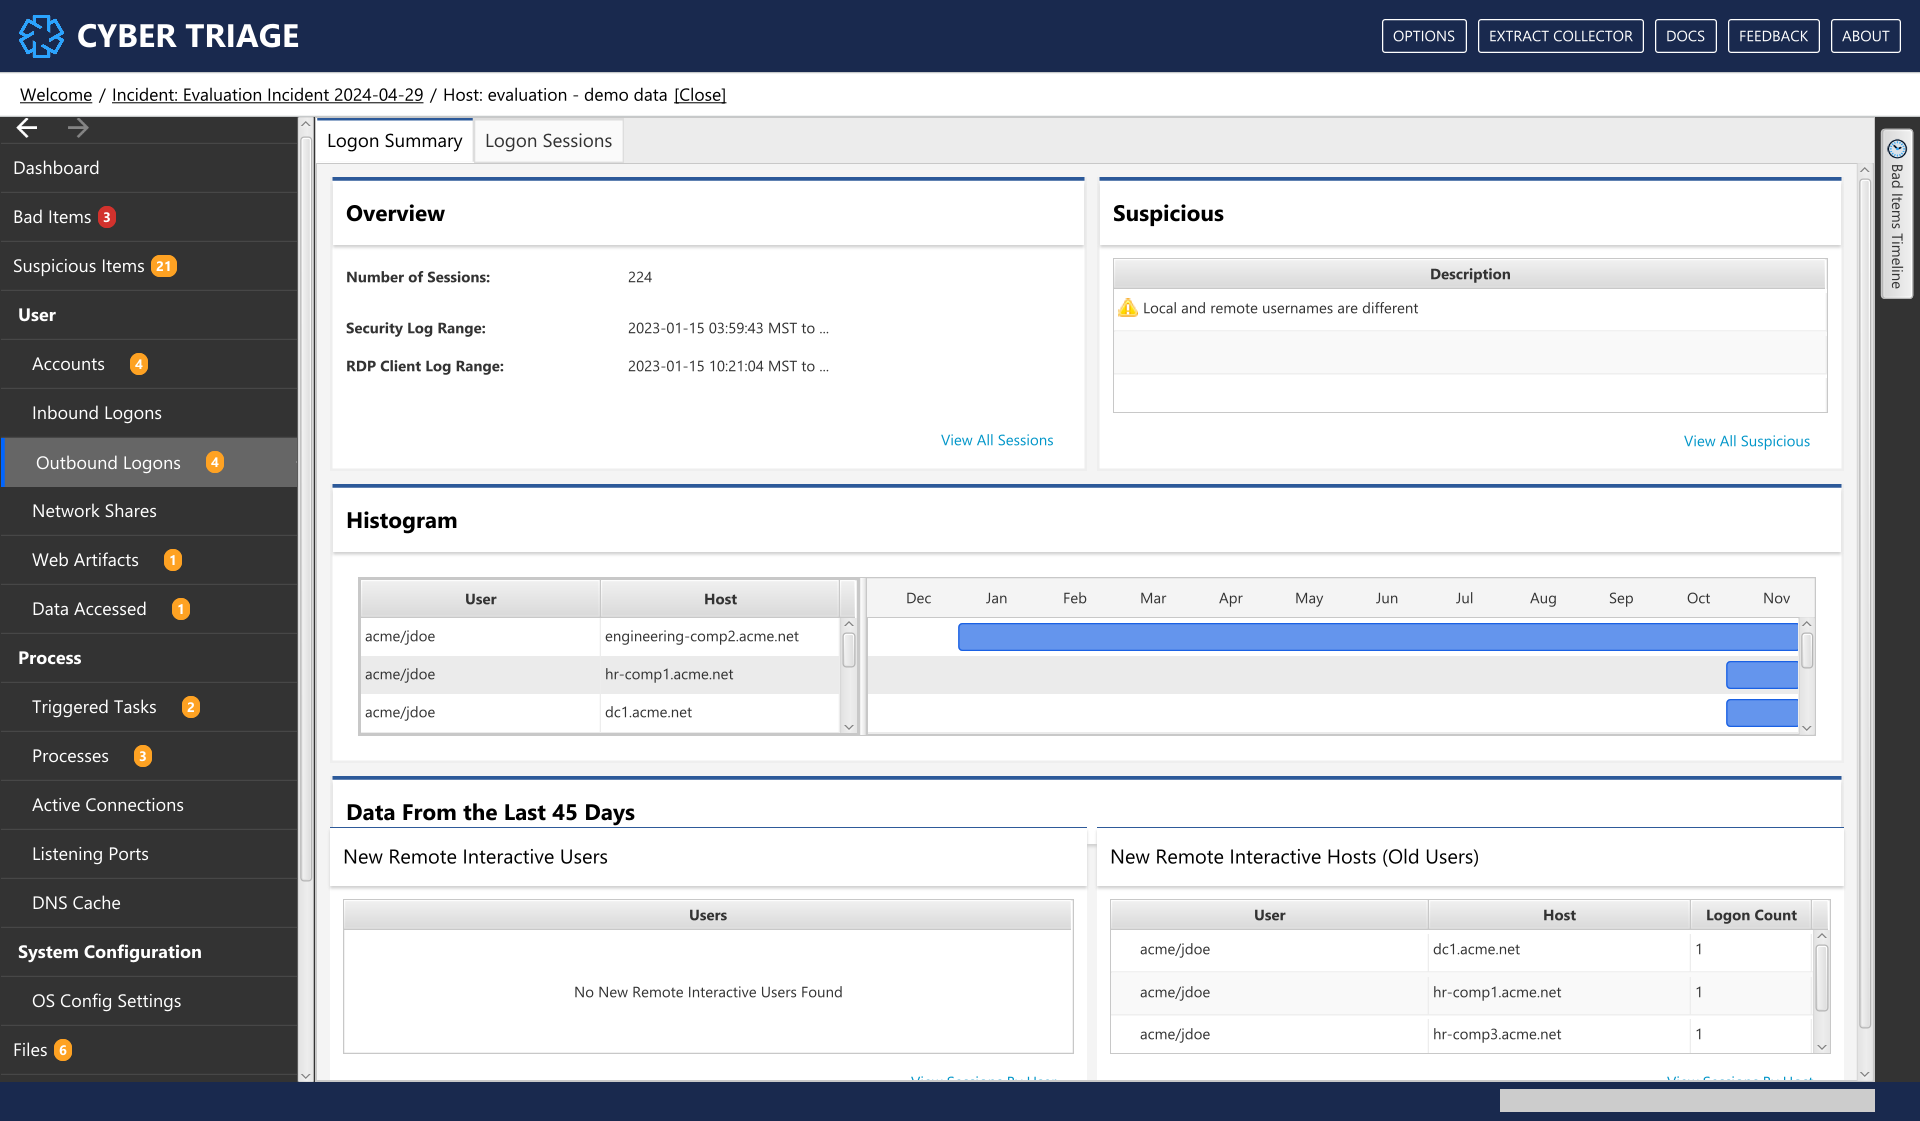
Inbound Logons Summary Interface
The following areas exist:
The Overview section gives you an overview of what kind of logon data exists. It gives the number of sessions and date ranges that were found in various logs. This will give you some idea about how much historical data you’ll be seeing.
The Suspicious section will give you the unique descriptions of why logons were scored as suspicious.
The Histogram section shows you which users logged into other systems and where they went for the last 12 months of the system (if there is enough data). For accounts with activity within the past two months, it will also show what host was used. The term “Various” in the host column means that multiple hosts were merged into a single row.
- The bottom part of the UI will show an overview of possibly interesting data from the last 45 days of the system:
The New Interactive Users section shows users started to have outbound logons. This could be from an attacker gained access to this system and started to laterally move around. Or, it could be a new employee or a change in job responsibility.
The New Interactive Hosts (Old Users) section shows which hosts that existing users started to use. For example, if user ‘jdoe’ has used the computer for 1-year, then they will only show up in this table if they start to log onto new hosts. This could be from an attacker or change in job responsibility.
8.7.3.2. Outbound Logon Search Panel
The search interface allows you to view all outbound logons organized by local user and remote host.
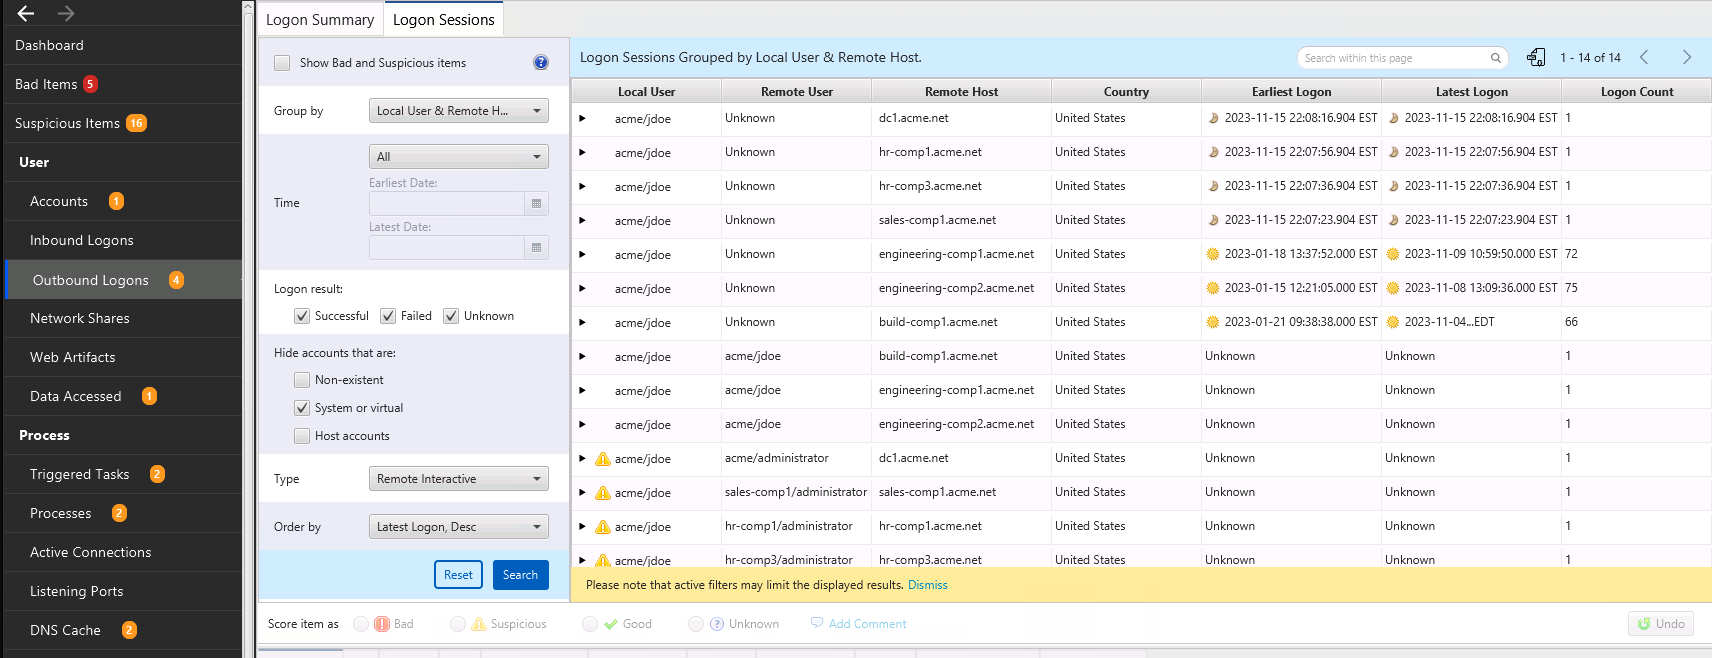
Outbound Logons Interface
You can change the search criteria to focus on time ranges or types of logons. The following filters exist:
Show all suspicious items will show only logons that are scored as suspicious.
Group by will allow you to group the sessions so that you can identify anomalous combinations of hosts and users. By default, the sessions are grouped by remote host and local user, but you can focus instead only on local users or on remote hosts.
Time will allow you to focus on sessions that occurred within the time range. This allows you to, for example, ignore sessions that happened a year ago.
Order By allows you to specify how the groups are sorted. By default, it shows the most recent logons first, but you can also order by host, etc.
You can select a group and then see individual sessions. Selecting a session allows you to see details on the bottom about the user and hosts.
What Should You Do: Review this data to look for suspicious hosts, users, and times. Cyber Triage® may mark some of them as being suspicious and you should review those and others to identify them as Good or Bad.
8.7.4. Network Shares
This Network Shares menu item shows the remote network shares that were accessed. These are determined by explicit mounts and paths in processes, data accessed, etc.
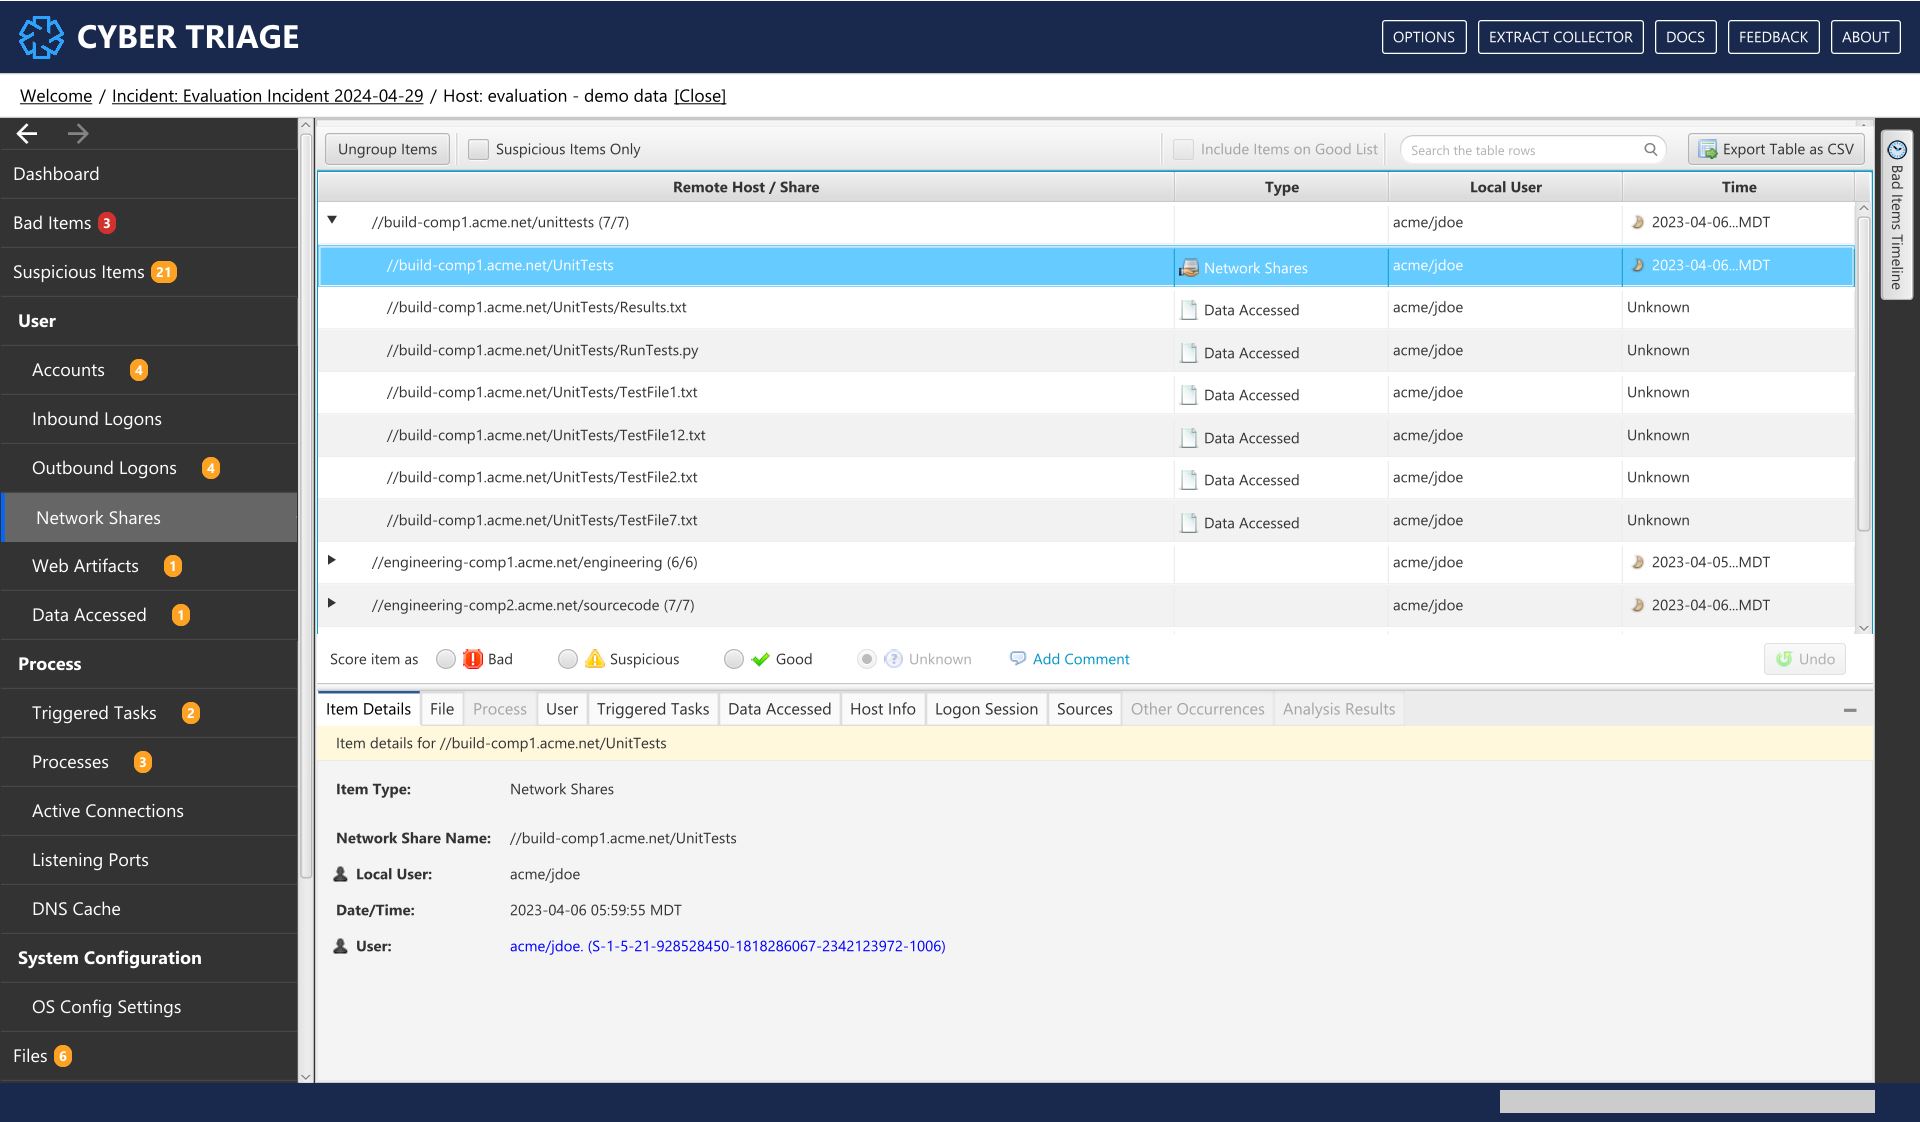
Network Shares Interface
The rows in this table are grouped by remote host and rows include share name, users, and times.
What Should You Do: You should review this data to look for shares that the user should not have needed access to. This could indicate that the account was compromised or the user is looking for sensitive data.
8.7.5. Web Artifacts
The Web Artifacts menu item shows web history, bookmarks, downloads, and cookies from Chrome, Firefox, Edge, and IE browsers. You can use this information to see what the user was viewing or what they downloaded. This is useful for phishing campaigns that cause the user to download executables or when you suspect an insider.
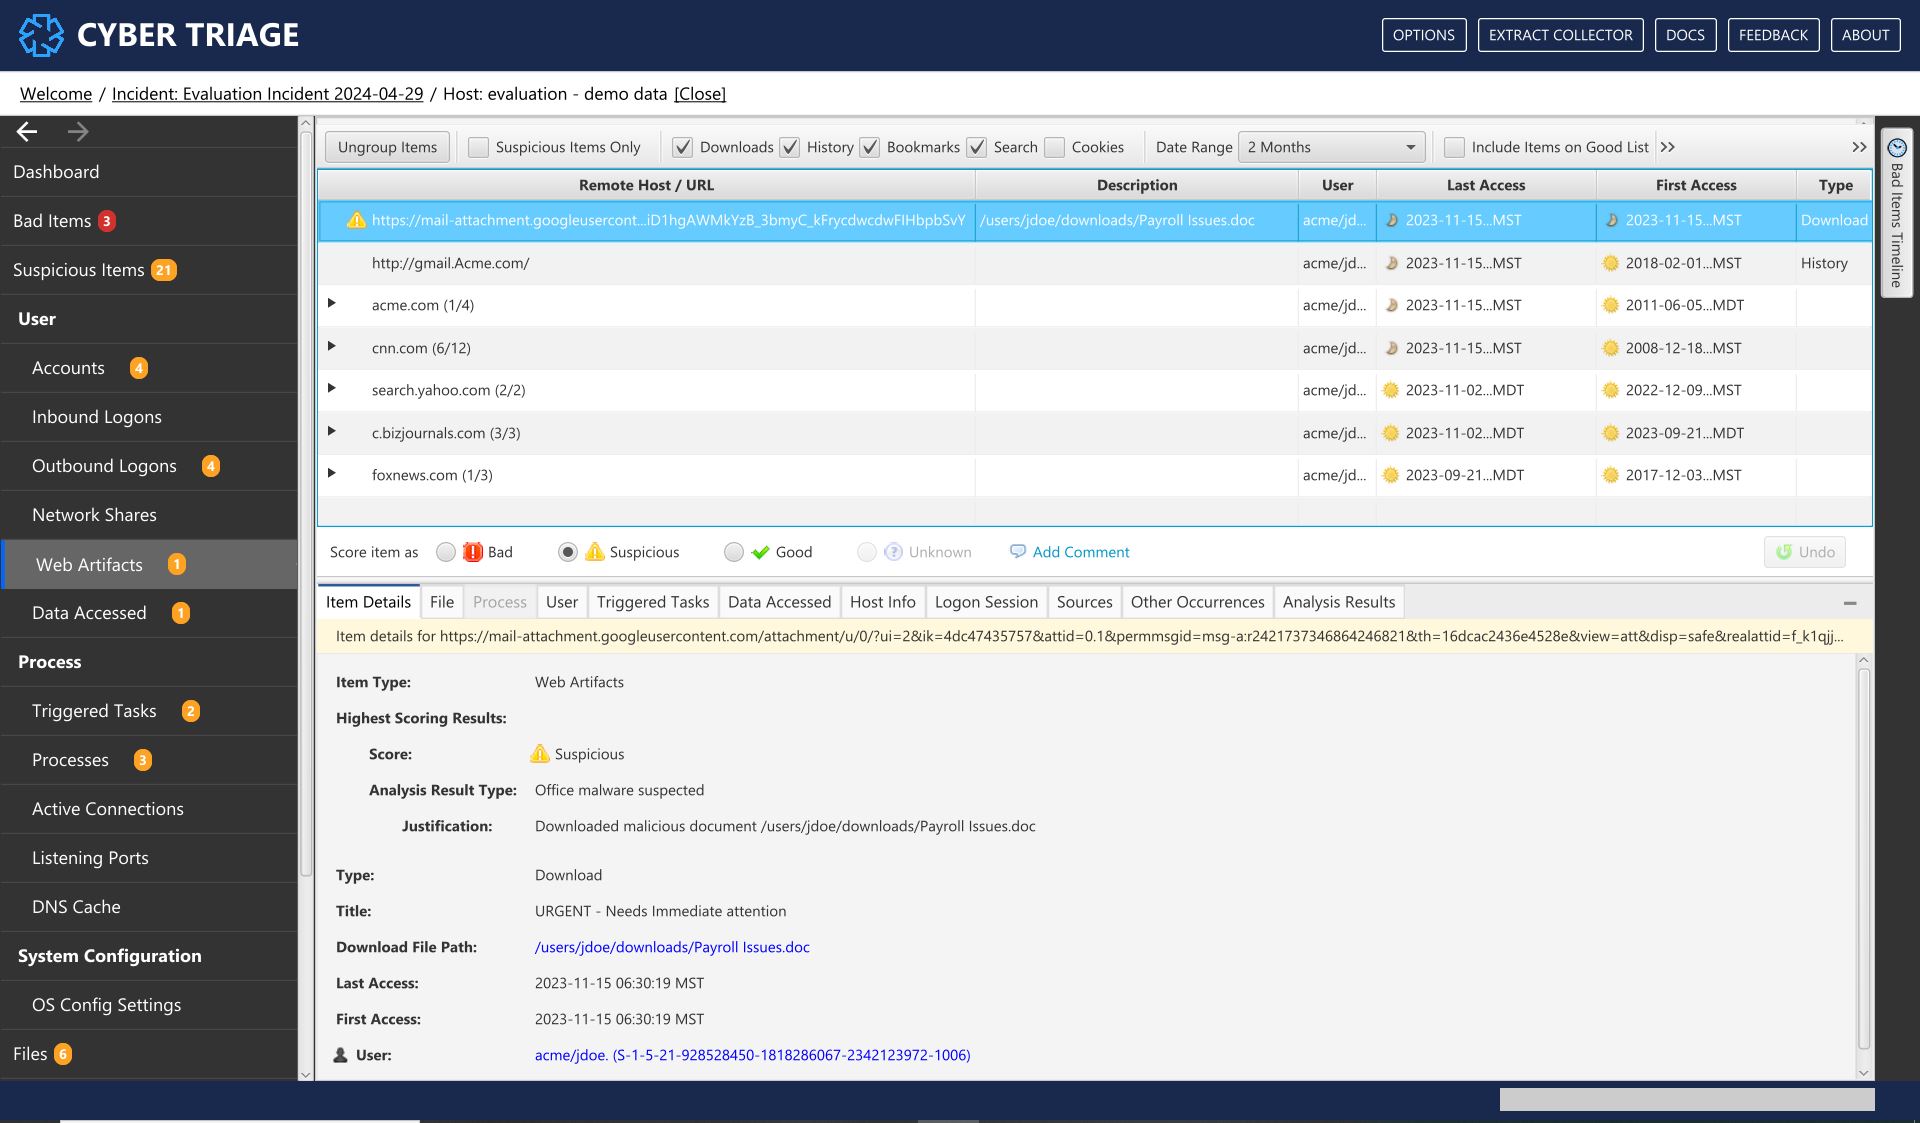
Web Artifacts Interface
What Should You Do: Review these items to look for suspicious downloads or search queries. You can filter based on type and date range.
8.7.6. Data Accessed
The Data Accessed menu item shows files or folders that a user accessed. This could have been because they opened or saved a file on the machine. Example contents of this section include Most Recently Used (MRU) lists.
You can use this information to see what data the user accessed during their session. Attackers may open files while looking for sensitive information. It can also show if Phishing documents were opened.
Data Accessed Interface
What Should You Do: Review these items to look for suspicious data the user may have accessed, which you can filter by date range.
8.8. Process Information Artifact Types
8.8.1. Triggered Tasks
The Triggered Tasks menu item shows any program that will launch based on some trigger, such as the computer starting, a user logging in, or some other event. Examples include AutoRuns, Scheduled Tasks, WMI Actions, BITS Jobs, services, and cron jobs.
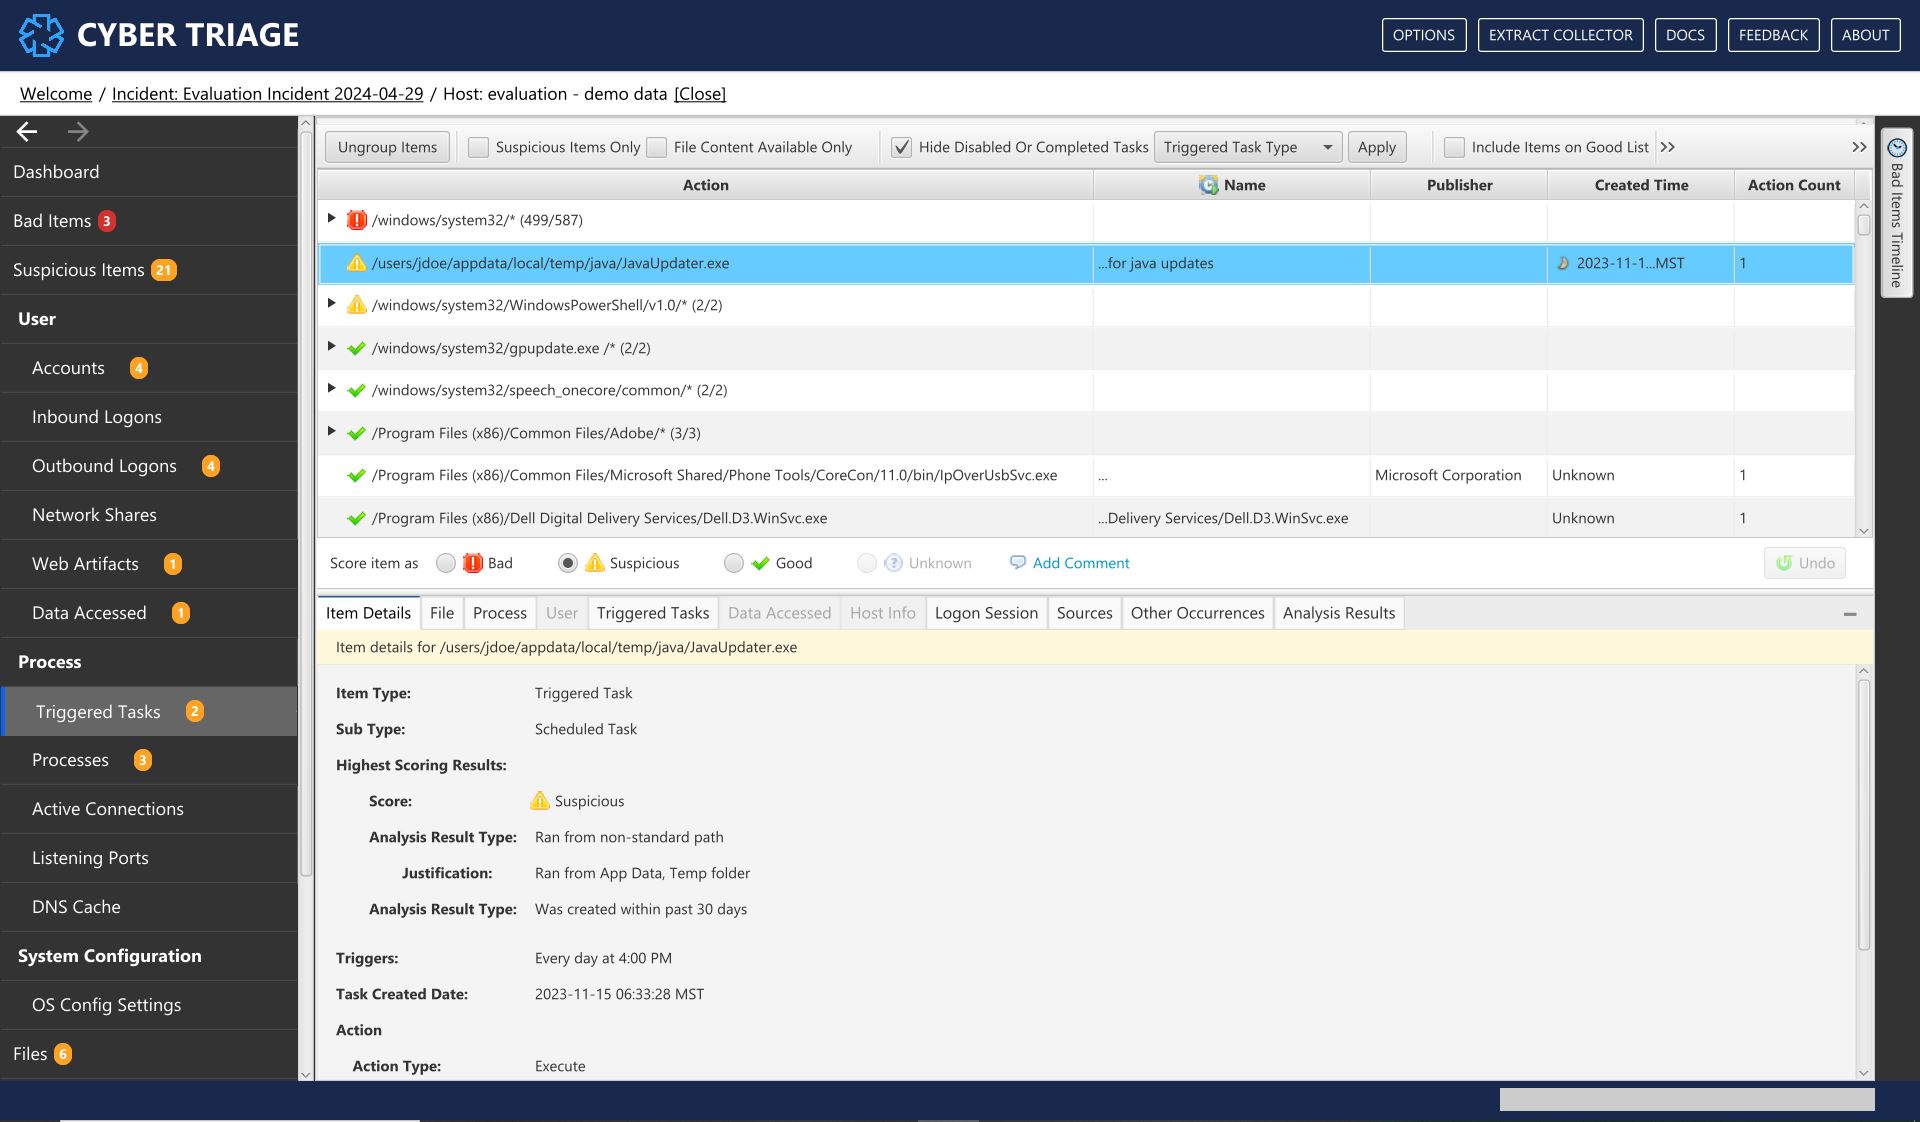
Triggered Tasks Interface
What Should You Do: Review the scheduled tasks and actions to identify ones that could be malicious programs that periodically run to check the system status or query a remote server. Look for suspicious paths, times, or names. You may find it useful to add the scheduled tasks that are known and common in your environment to a Global Good List.
8.8.2. Processes
The Processes menu item shows the programs that were running at the time of collection or that ran in the past. The historical data comes from registry data and other system files (such as Prefetch).
You should review this data to look for suspicious processes. Cyber Triage will flag ones that ran out of unexpected places or had unexpected parents.
There are two UI panels that you can change via the tabs on the top:
Processes: Is a search-like interface that allows you to search for processes with certain features (such as times, signatures, etc.)
Process Tree: Shows the tree hierarchy of the processes at the time of collection.
8.8.2.1. Process Search Panel
When you first open the Processes section, you’ll see the search panel, which shows the list of processes that meet the specified criteria. By default, the processes are grouped by executable and arguments, but the grouping can be changed to simply focus on executable or to also include the user.
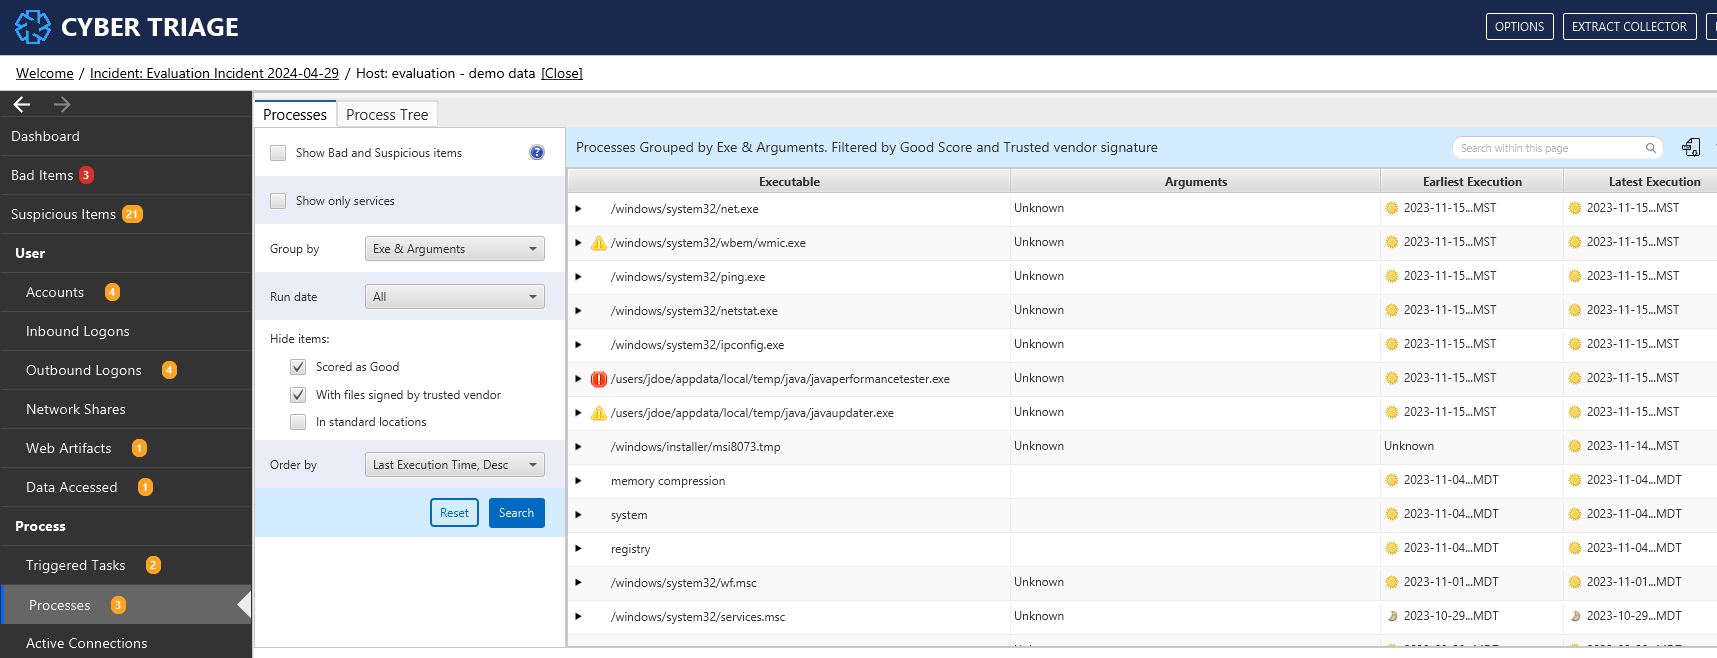
Processes Search Interface
By default, the groups are sorted by those that ran most recently.
There are several search parameters that you can specify:
Show Bad and Suspicious Items: Show only the processes that have been scored as bad or suspicious. You can use this to understand what was already scored by Cyber Triage.
- Group by: Allows you to change how all of the processes are grouped.
Exe & Arguments: The default, that shows the executable name and arguments. Arguments can dramatically change the behavior of a process, so it can be important to group by this to identify good versus bad usage.
Exe: Use this to see what programs were run, regardless of what arguments were supplied.
Exe, Arguments, & User: Use this to also differentiate who ran a process.
No Grouping: Use this to get a long list of all processes. This creates a process timeline.
- Run date: Show only processes that were running within that time frame, relative to time of collection. Note that some places that store historical process information do not have times and they will not be included in the search.
Last 1 day: Processes that were running in the 24-hours before collection (including a live collection snapshot). You can use this to look for unexpected processes. Note that other filters hide standard Windows processes, so this list is shorter than all processes.
Last 30, 60, etc: Same idea as “Last 1 day”, just for longer periods of time.
- Hide items: Allows you to not see certain types of processes IF you are looking for outliers and unexpected processes. Note that some of these filters may make it harder to detect Living Off the Land (LOL) usage.
Scored as Good: Hide processes that got a Good score from either a good list, malware analysis, or manual score. This is enabled by default.
Files signed by trusted certificate: Hide processes with an executable that is signed by a certificate that was trusted by the host. This is enabled by default.
In standard location: Hide processes running out of Windows or Program Files. This is disabled by default.
Order by: How to order the groups. The default is to order by most recent execution first. But, you can also sort by path or by frequency of usage.
When you select a group, you can go into it to see the individual process instances.
Once you’ve selected an instance, you maybe able to see its parent and children processes if it was running at the time of collection and you used the Cyber Triage collection tool. The “Process” tab in the lower right has a “Tree” tab that will show the parent and children. It will be disabled if this instance was known only from historical data.
If you have false positives from applications running out of non-standard locations (such as AppData), you can add them to the good list.
8.8.2.2. Process Tree Panel
An alternative view is to see the process tree. This works only if you did a live collection using the Cyber Triage collection tool. This view shows you the root processes and allows you to select a process and see its children. You can then recursively traverse the tree by pressing the “X children” text (if it has children).
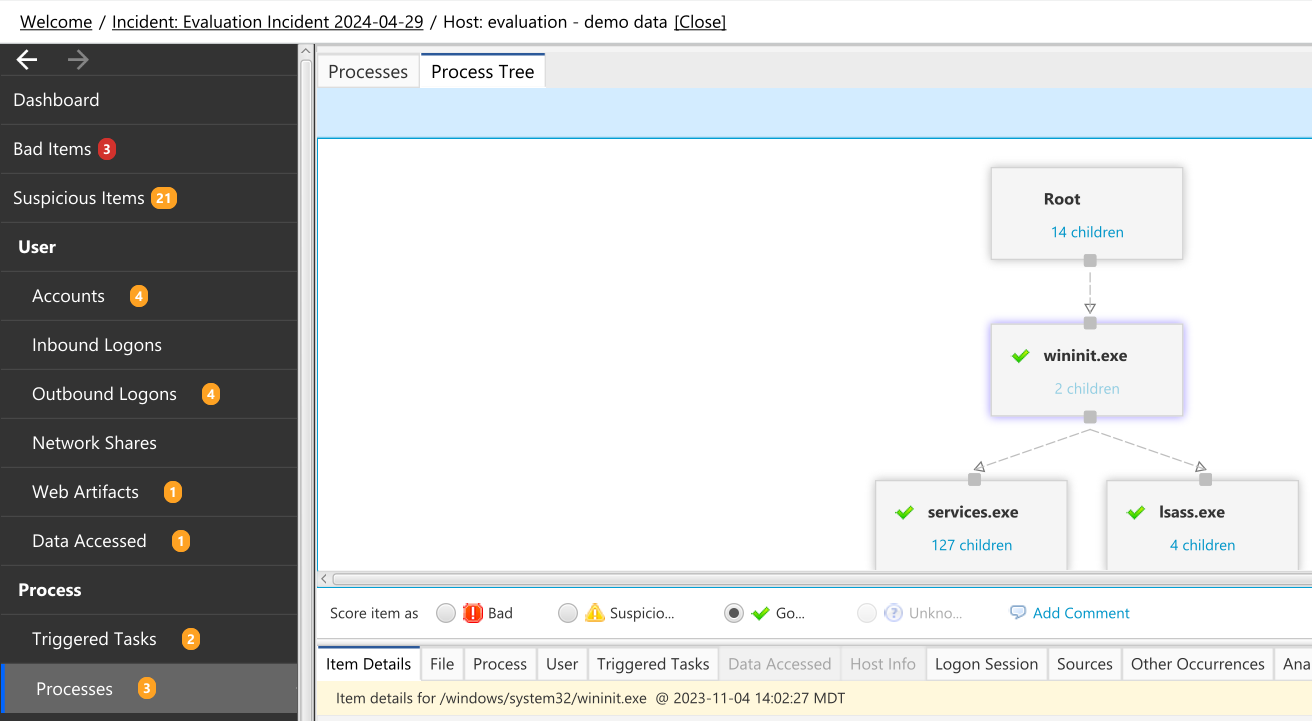
Processes Tree Interface
You can also use the “Export as PNG” button in the upper right to export the picture.
8.8.3. Active Connections
This Active Connections menu item shows the network connections that were open at the time the collection was made.
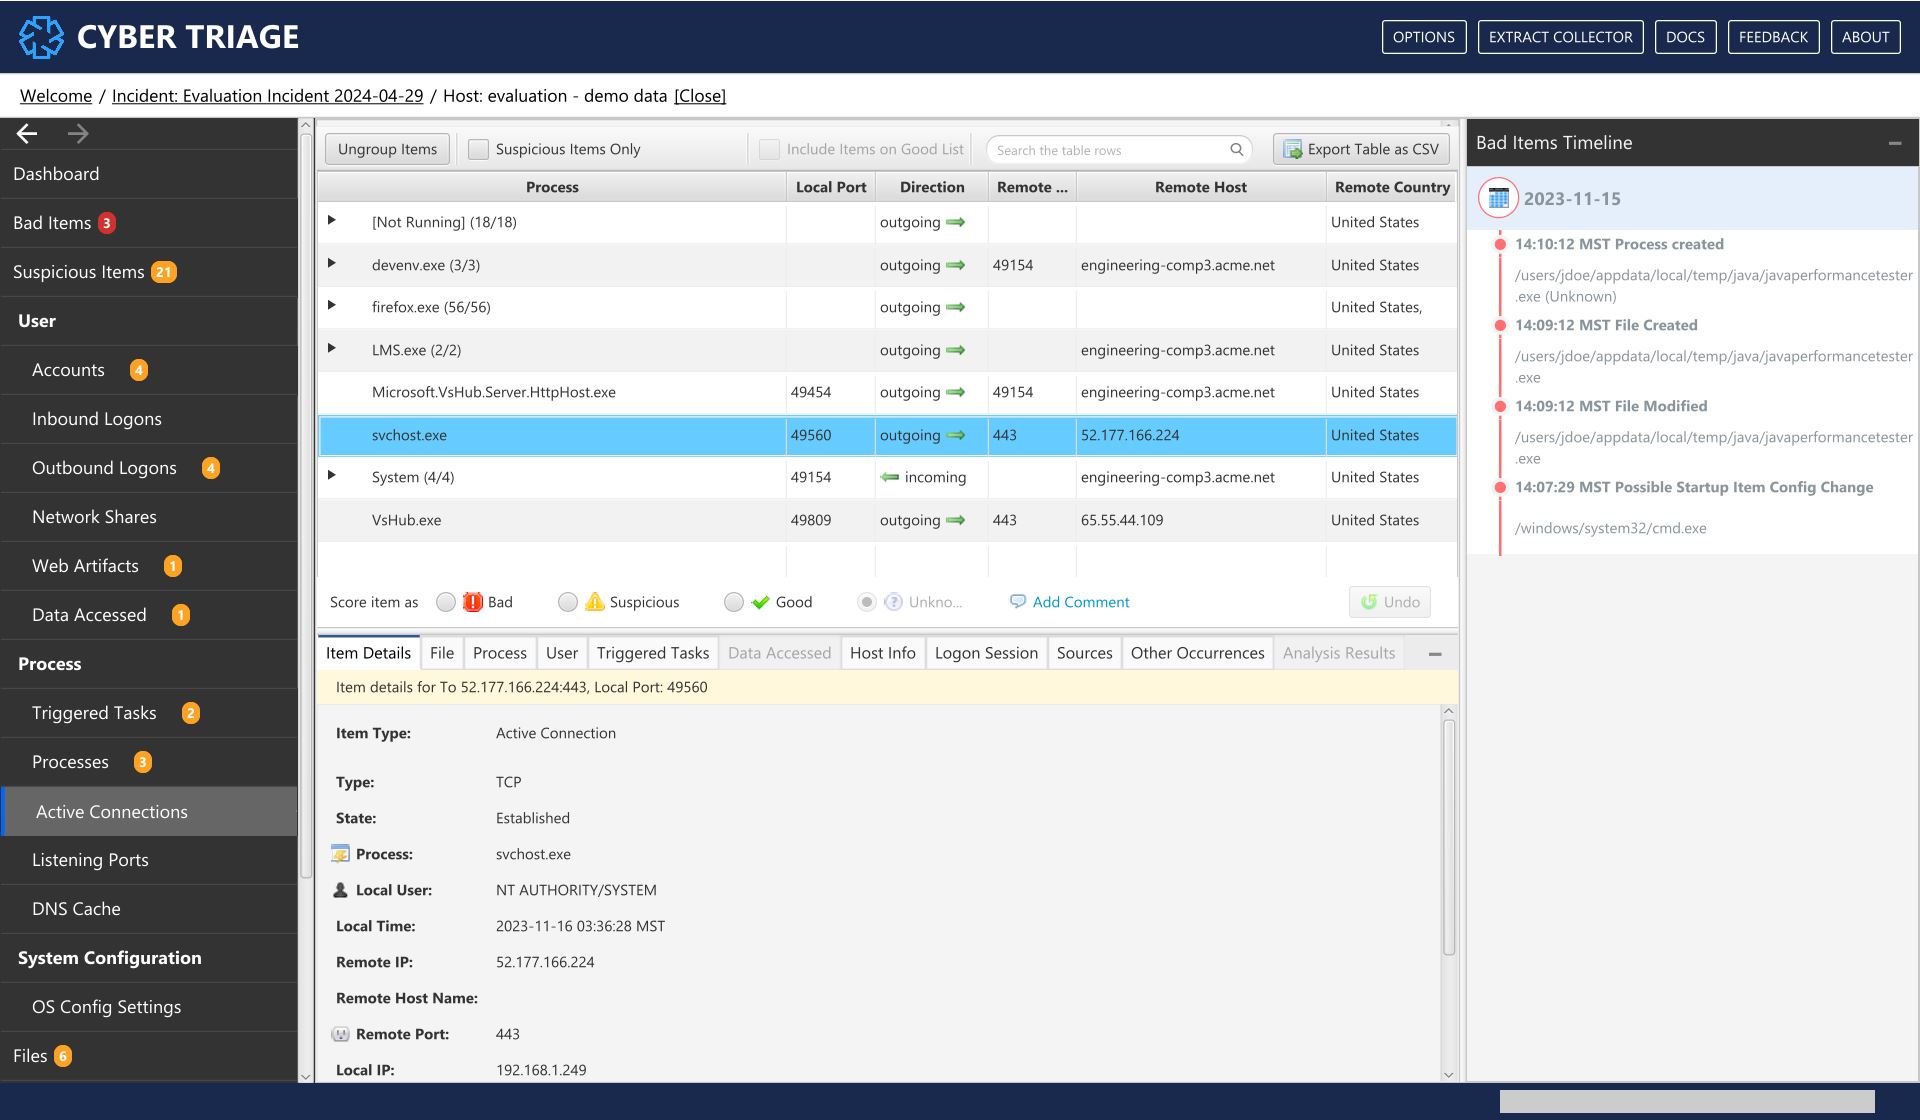
Active Connections Interface
The rows are grouped by remote host and have columns for the process with the connection, remote and local ports, times, and direction.
What Should You Do: You should review this data for connections to unexpected hosts and for processes with unexpected network
8.8.4. Listening Ports
The Listening Ports menu item shows the ports that were listening for new connections when the collection was made.
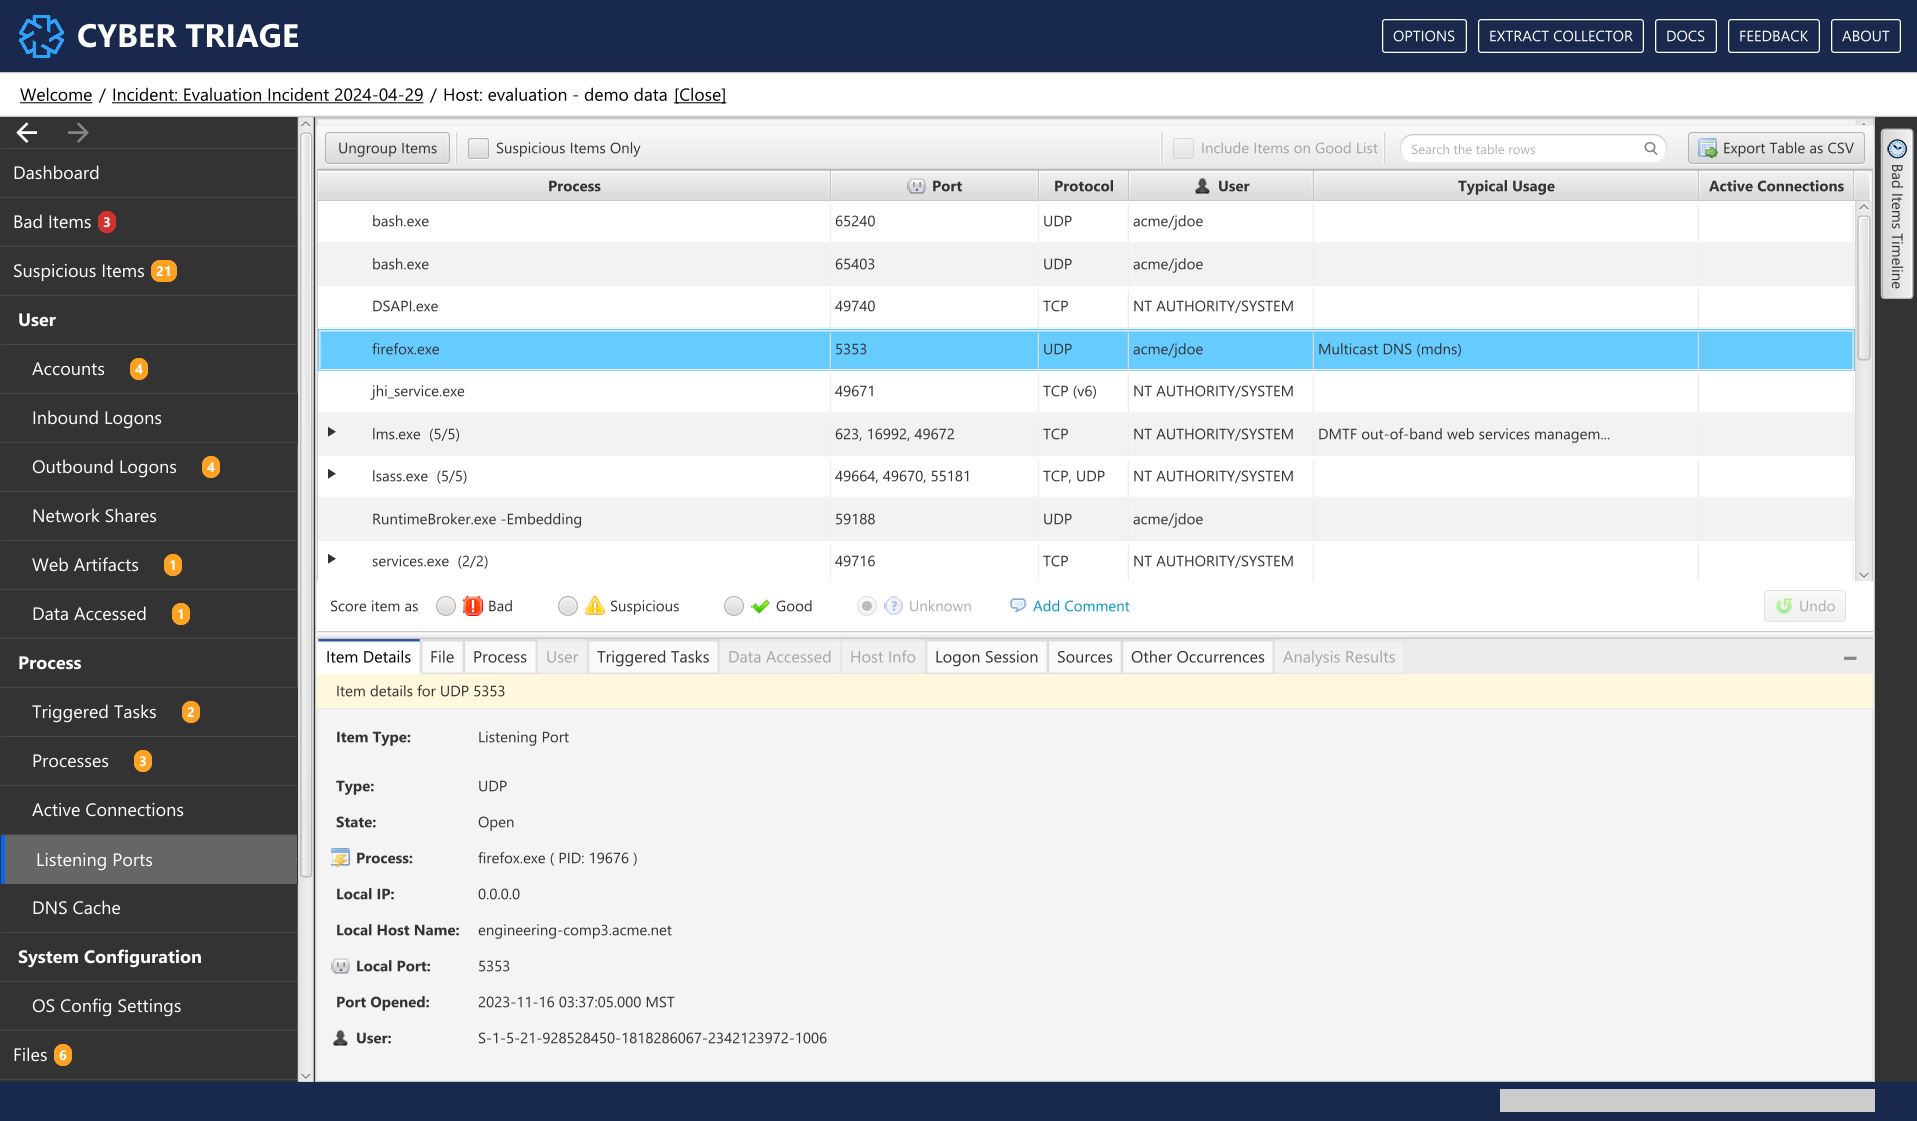
Listening Ports Interface
The rows are grouped by port number and have columns for the protocol, process, user, and information about what is usually at that port number.
What Should You Do: Review these to processes that you did not expect to be listening for a connection. These could be backdoor applications into your system. Consider adding ports that are normal in your environment to a Good List.
8.8.5. DNS Cache
The DNS Cache menu items shows the contents of the DNS cache, which contains references to the hosts that the computer tried to resolve to an IP address. You will find addresses in here that the system previously connected to.
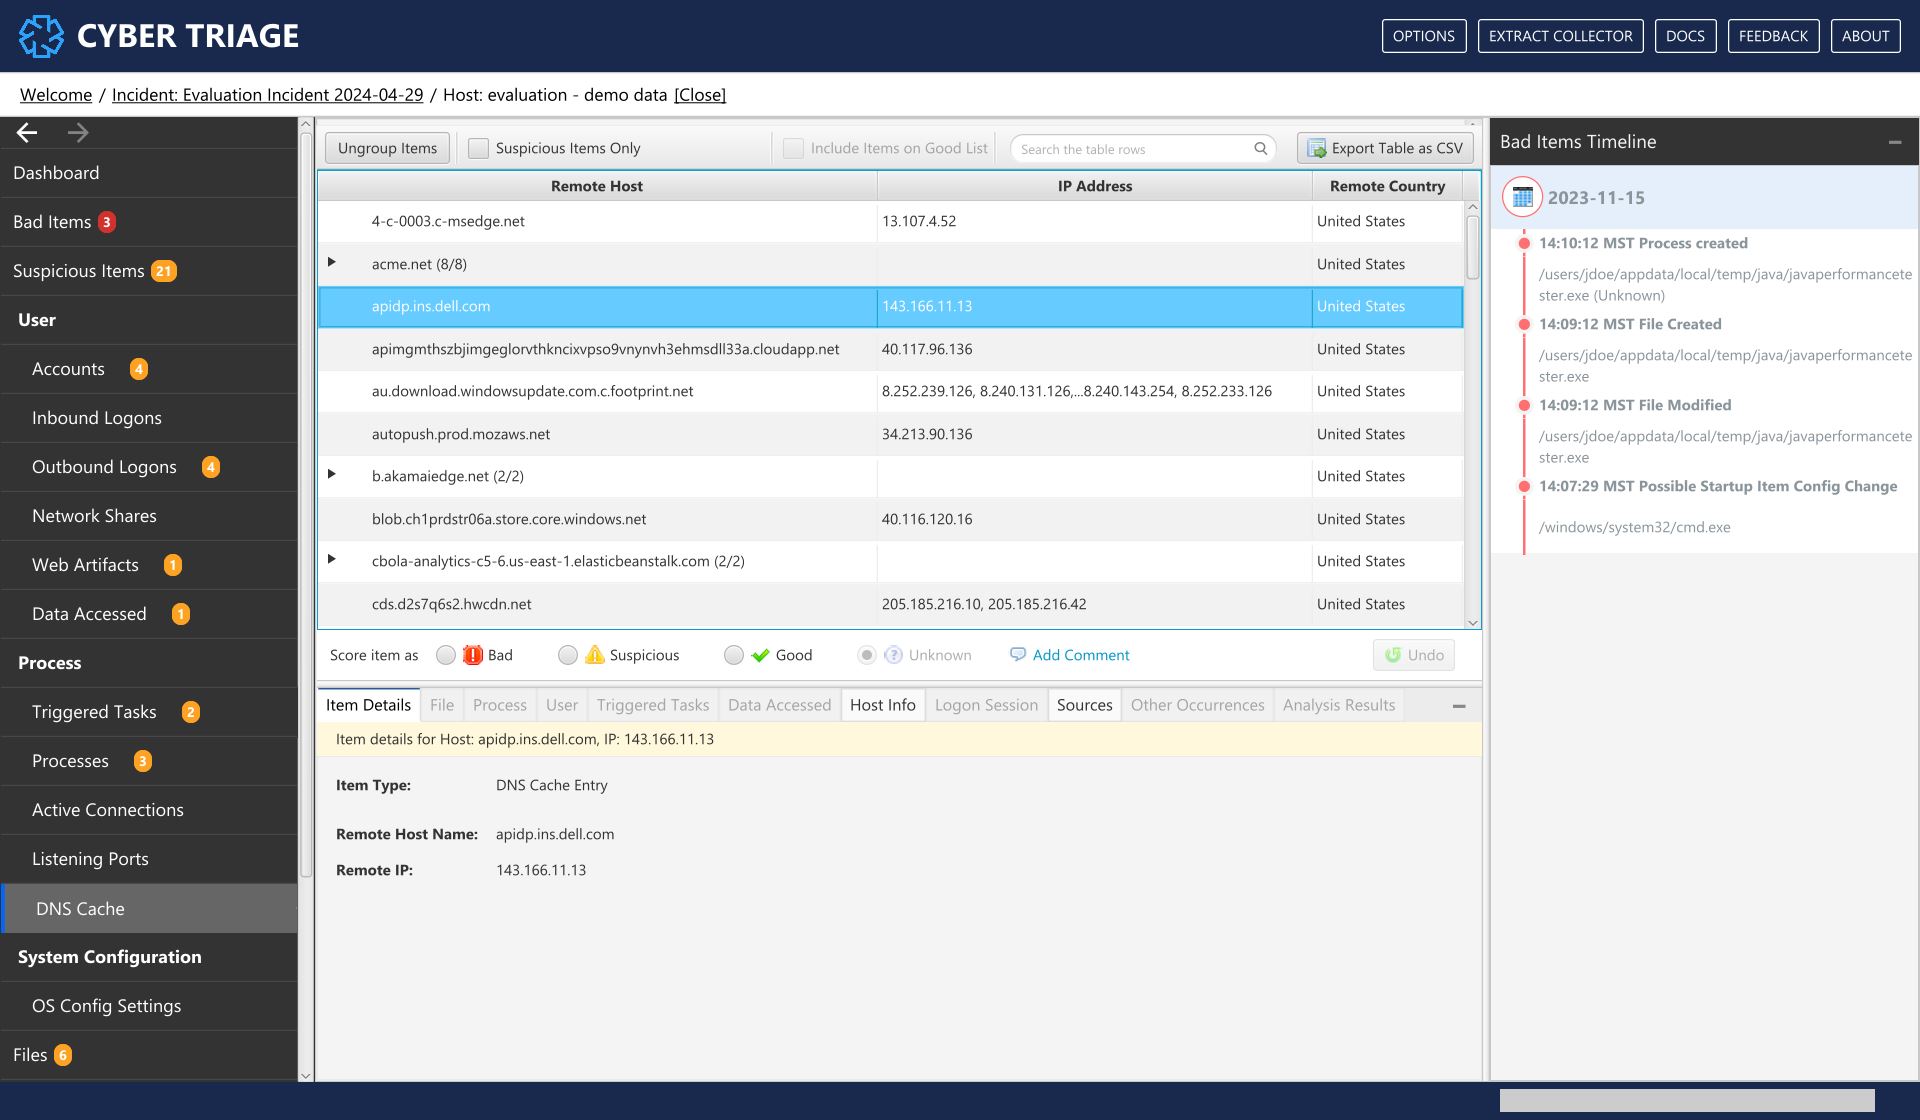
DNS Cache Interface
The rows are grouped by remote host domain and have columns for IP and country.
What Should You Do: You should review the data here for suspicious items and connections to suspicious hosts or countries.
8.9. System Confirmation Information Artifact Types
The System Configuration section focuses on artifacts associated with the operating system.
8.9.1. OS Config Settings
This area shows you various OS and application settings that were enumerated during the collection. These come from various registry keys and other configuration files.
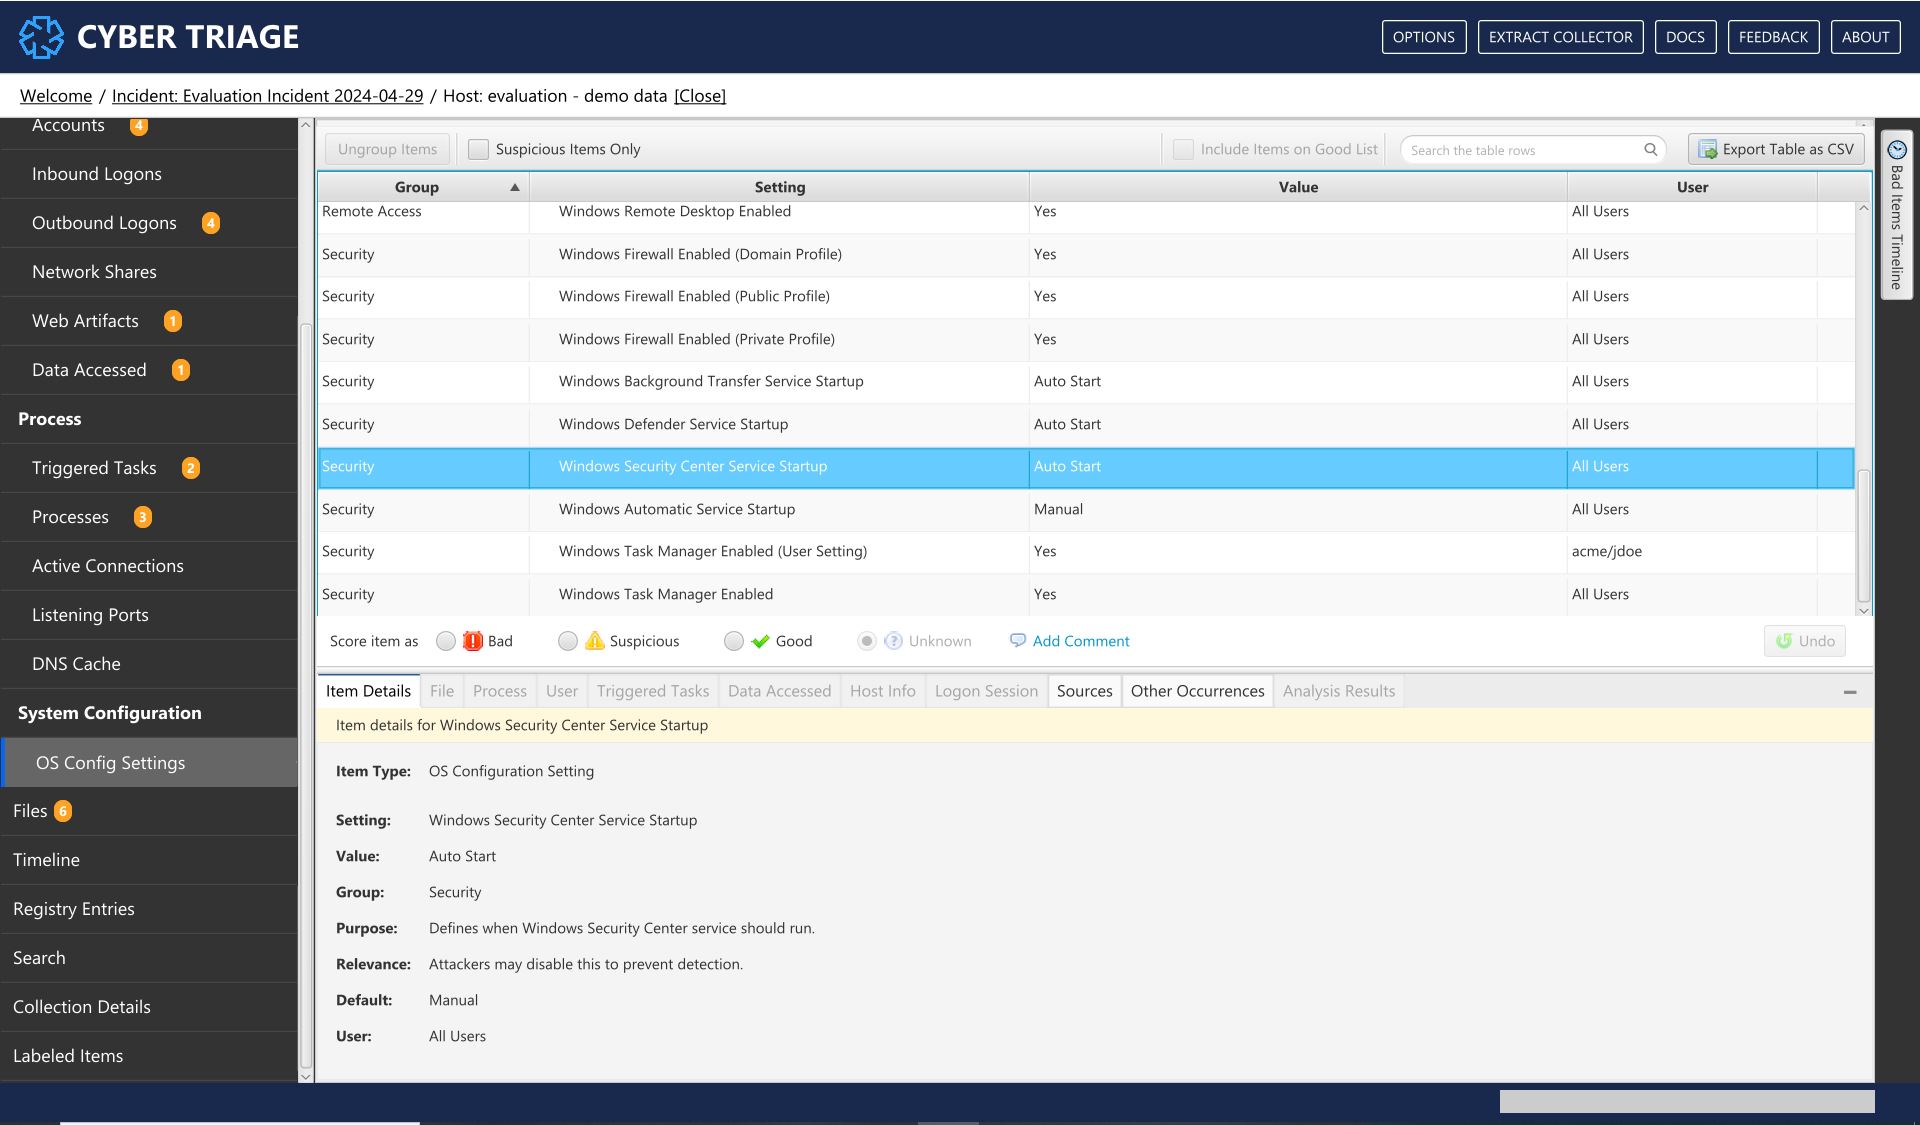
Settings Interface
What Should You Do: Review the data to detect if any security settings were disabled or determine what the audit settings were.
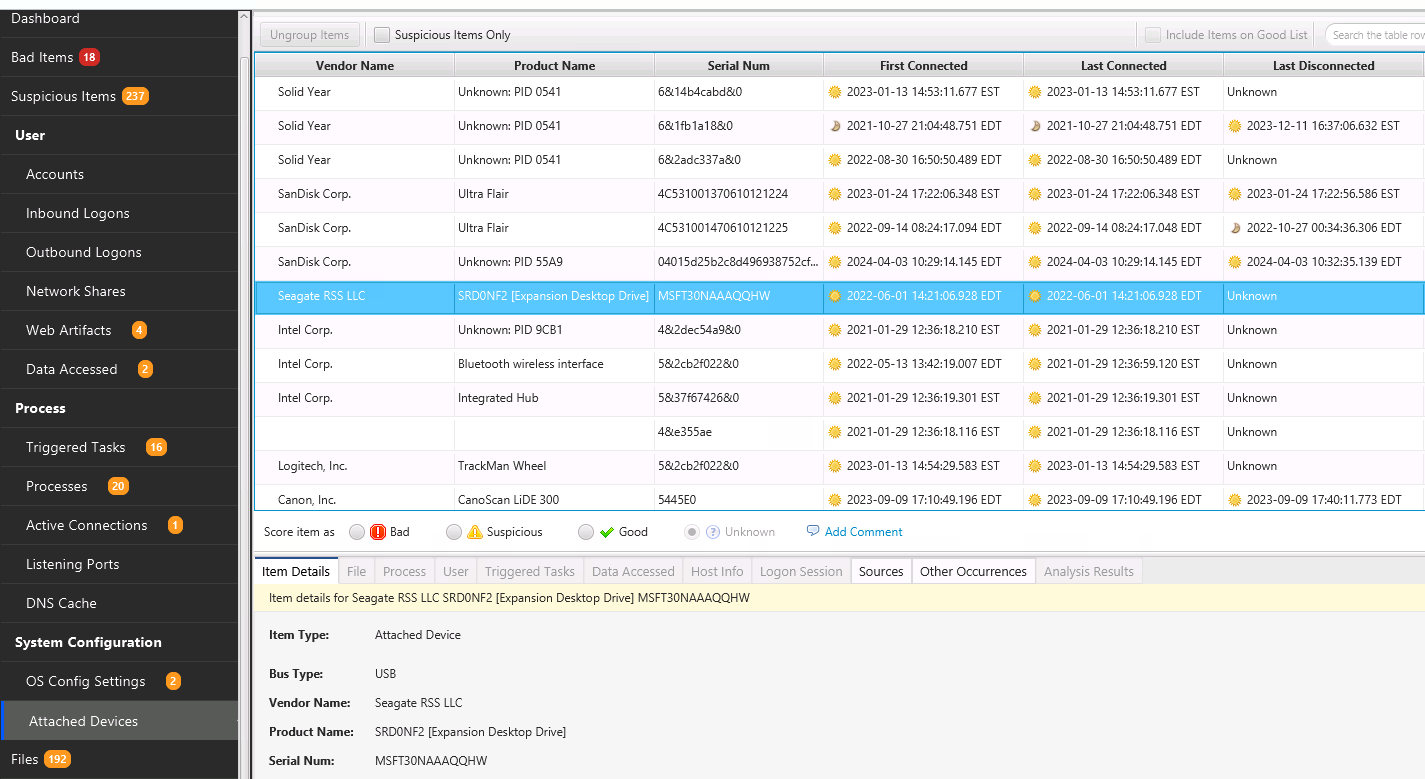
8.9.2. Attached Devices
This area shows you what removable devices were attached to the host. This will most typically show USB devices. You can use the “Sources” tab to identify which data artifact it was derived from.
Cyber Triage will map some common vendor and product IDs to display names instead of numbers.
8.10. Additional Examination Views
Cyber Triage has other views that merge multiple types of artifacts, such as timelines and search.
8.10.1. File Explorer
The Files menu item can show several things:
If a full file system scan was performed, you can view all file metadata. Though, content for all files will not be available.
You can view only suspicious or bad files.
You can get to a file by either choosing the Files menu item and navigating the structure. Or, when you are reviewing an item associated with a file, such as a Triggered Task item, you can right click and choose to View File in Directory.
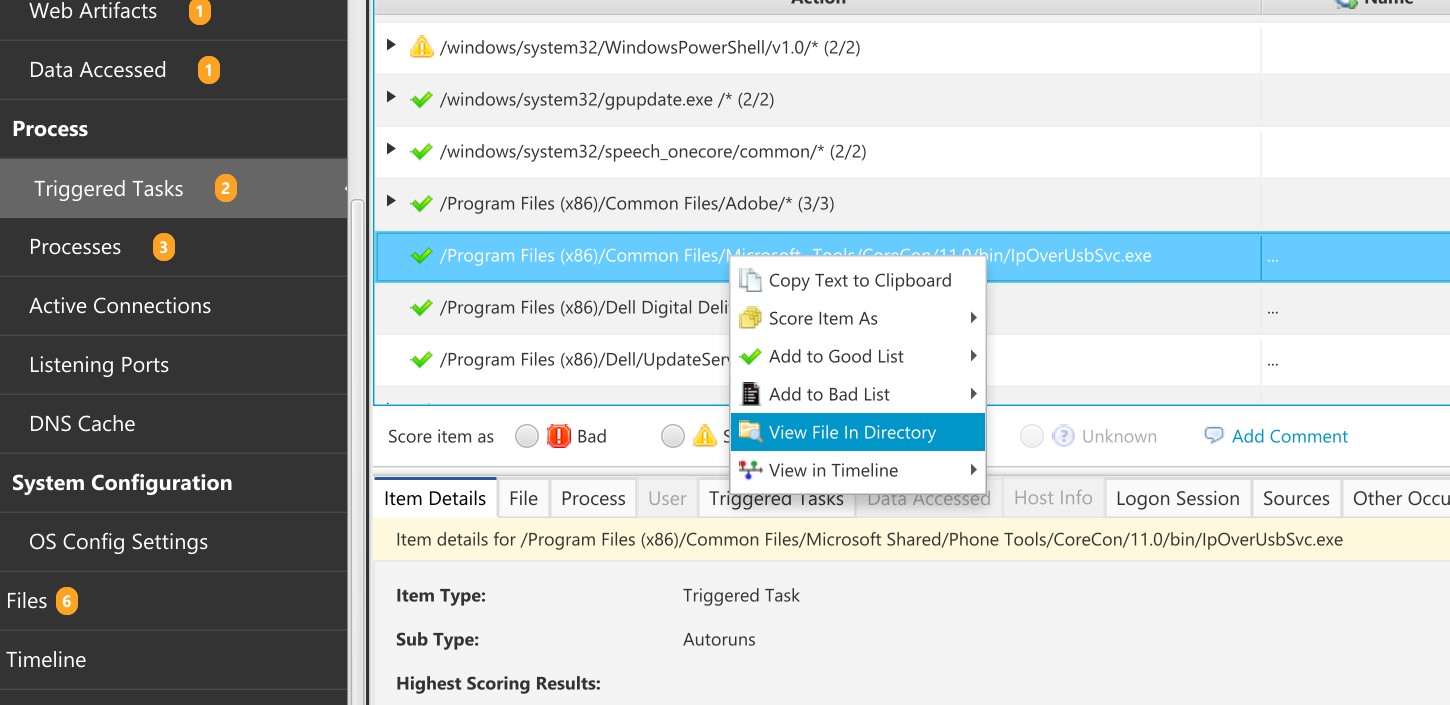
View File in Directory
That will then bring you directly to the file:
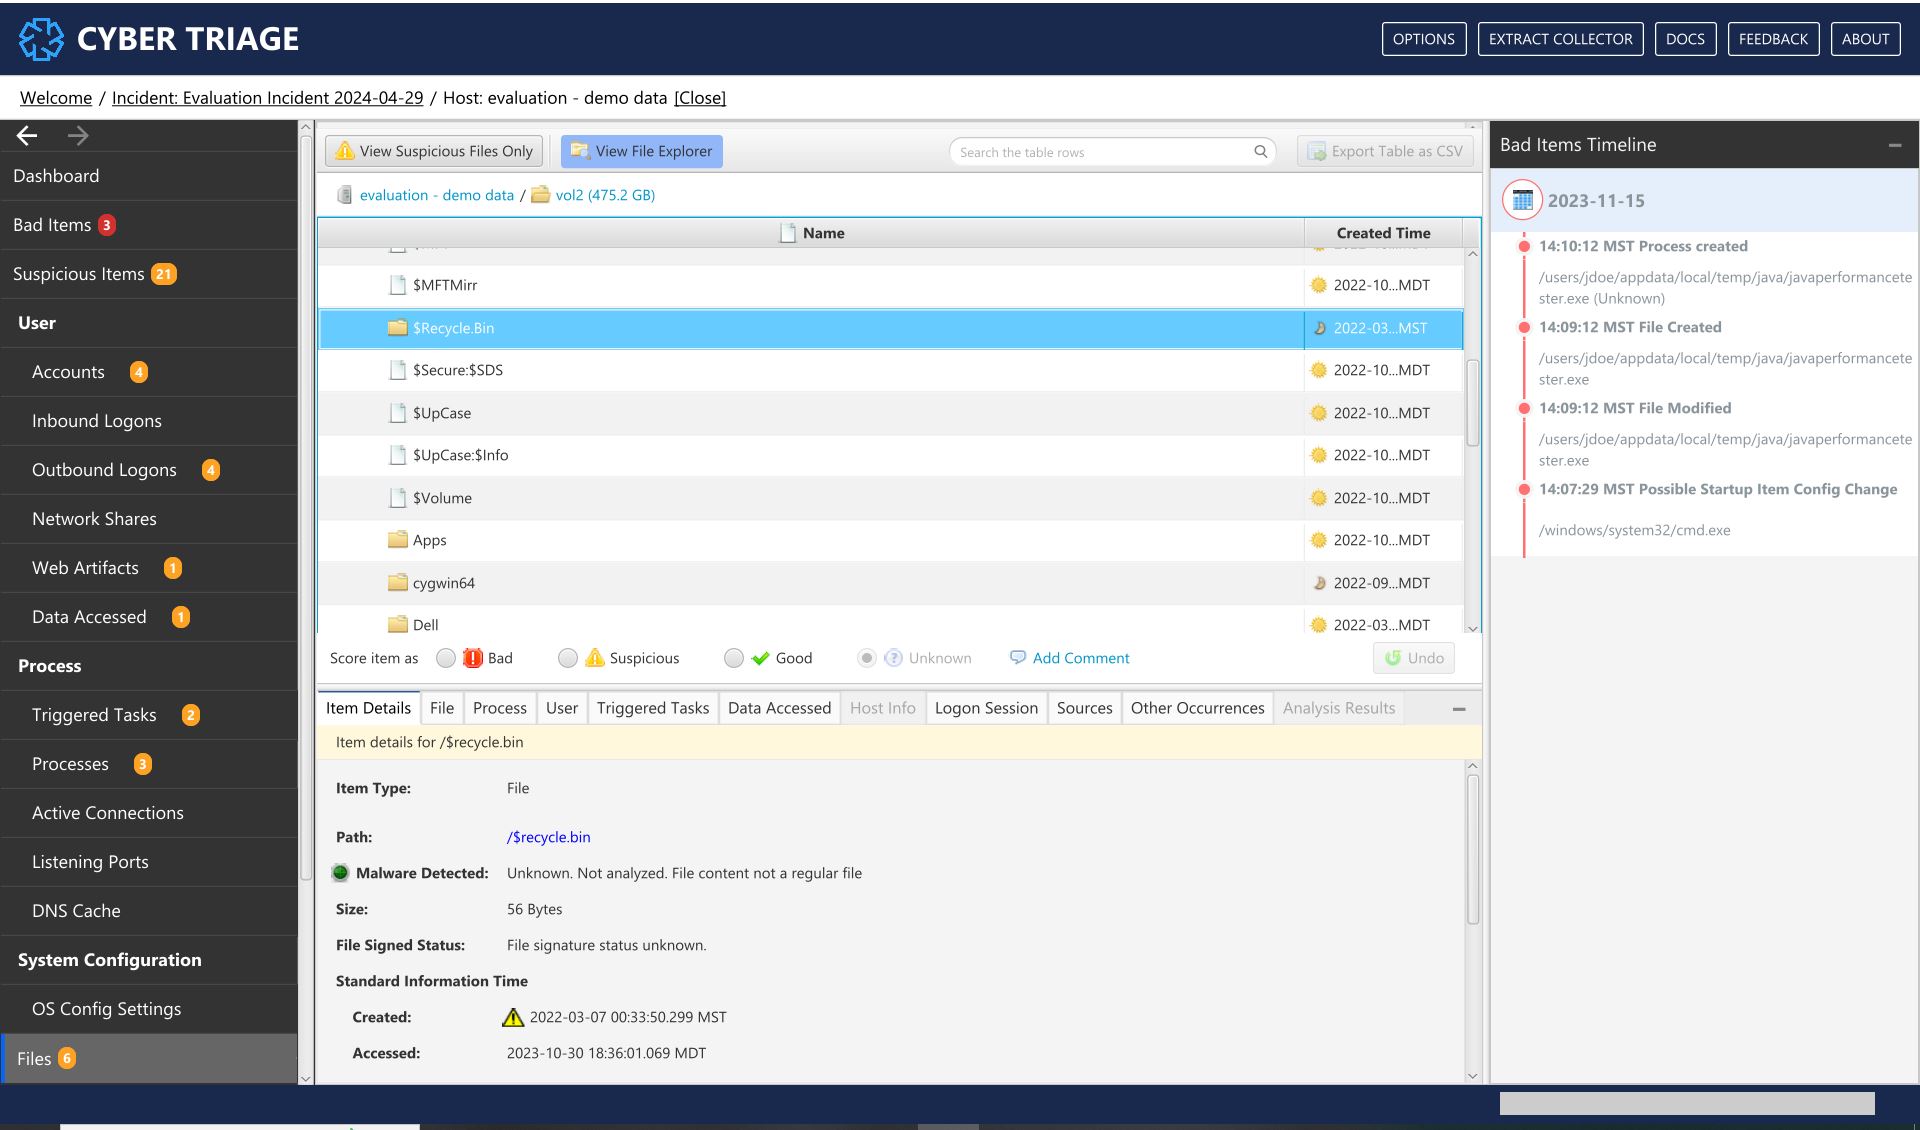
File Interface
What Should You Do: Review the suspicious entries. The files flagged as malware will also be in the Bad Items menu item. You can also use this to see what other files are located in the same folder as malware and other Bad Items.
8.10.2. Timeline
This area shows you the collected items organized by time. You can use this data to identify what happened before and after a specific event.
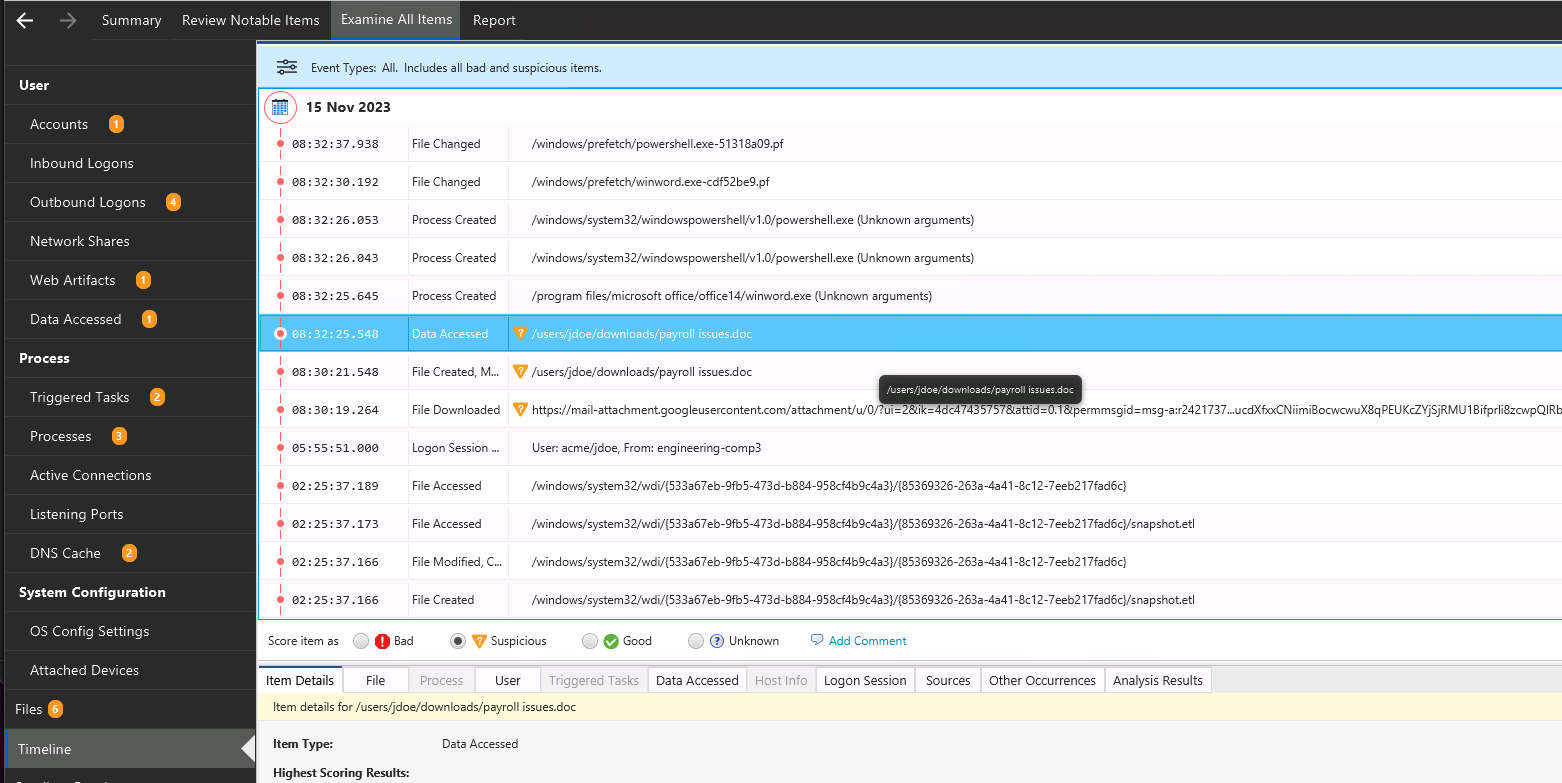
Timeline Interface
You can get to this data by either selecting Timeline from the left side and picking a date range or right clicking on most entries in their respective table and choosing View in Timeline.
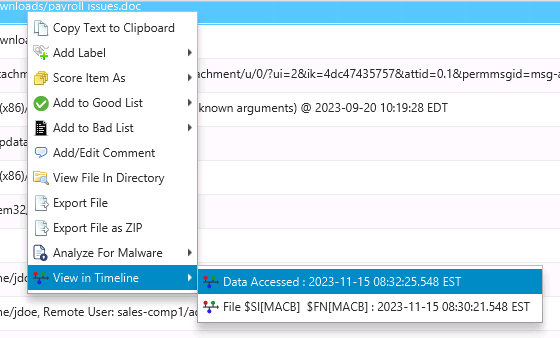
Choose View Timeline
At any point, if the timeline becomes overwhelming, you can reduce the amount of data shown by using the filters:
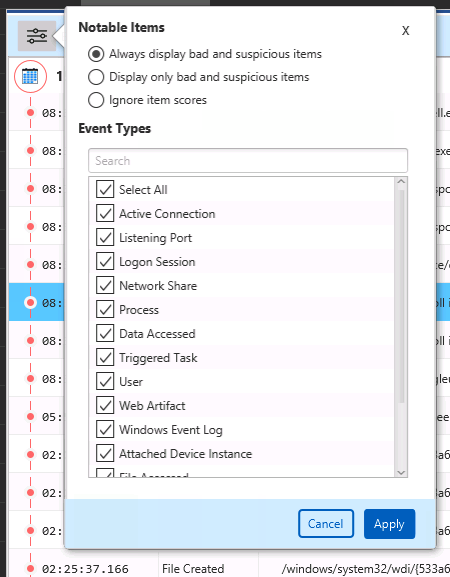
The Notable Items filter allows you to pick what types of scored items to include:
“Always display bad and suspicious” means that regardless of the other filters, each bad and suspicious will always be shown to make sure you have the full context of what is known.
“Display only bad and suspicious” means that you will only see items with a score. This is basically equivalent to the “Review Notable Items” view.
“Ignore item scores” means that scores will not be considered. Only the other filters will be used.
The Event Types Filter allows you to pick what artifact types to display. You can also choose which file times to include or hide.
8.10.3. File and Artifact Host Search
You can search all artifacts and file metadata in the host for specific keywords. This is not a full text search of file content. It will search data such as paths, arguments, host names, hash values, and scores.
To search: 1. Choose Host Search from the lower left of application 2. Enter in the search term. The search will be case insensitive and regular expressions are not supported. You can also specify a date range.
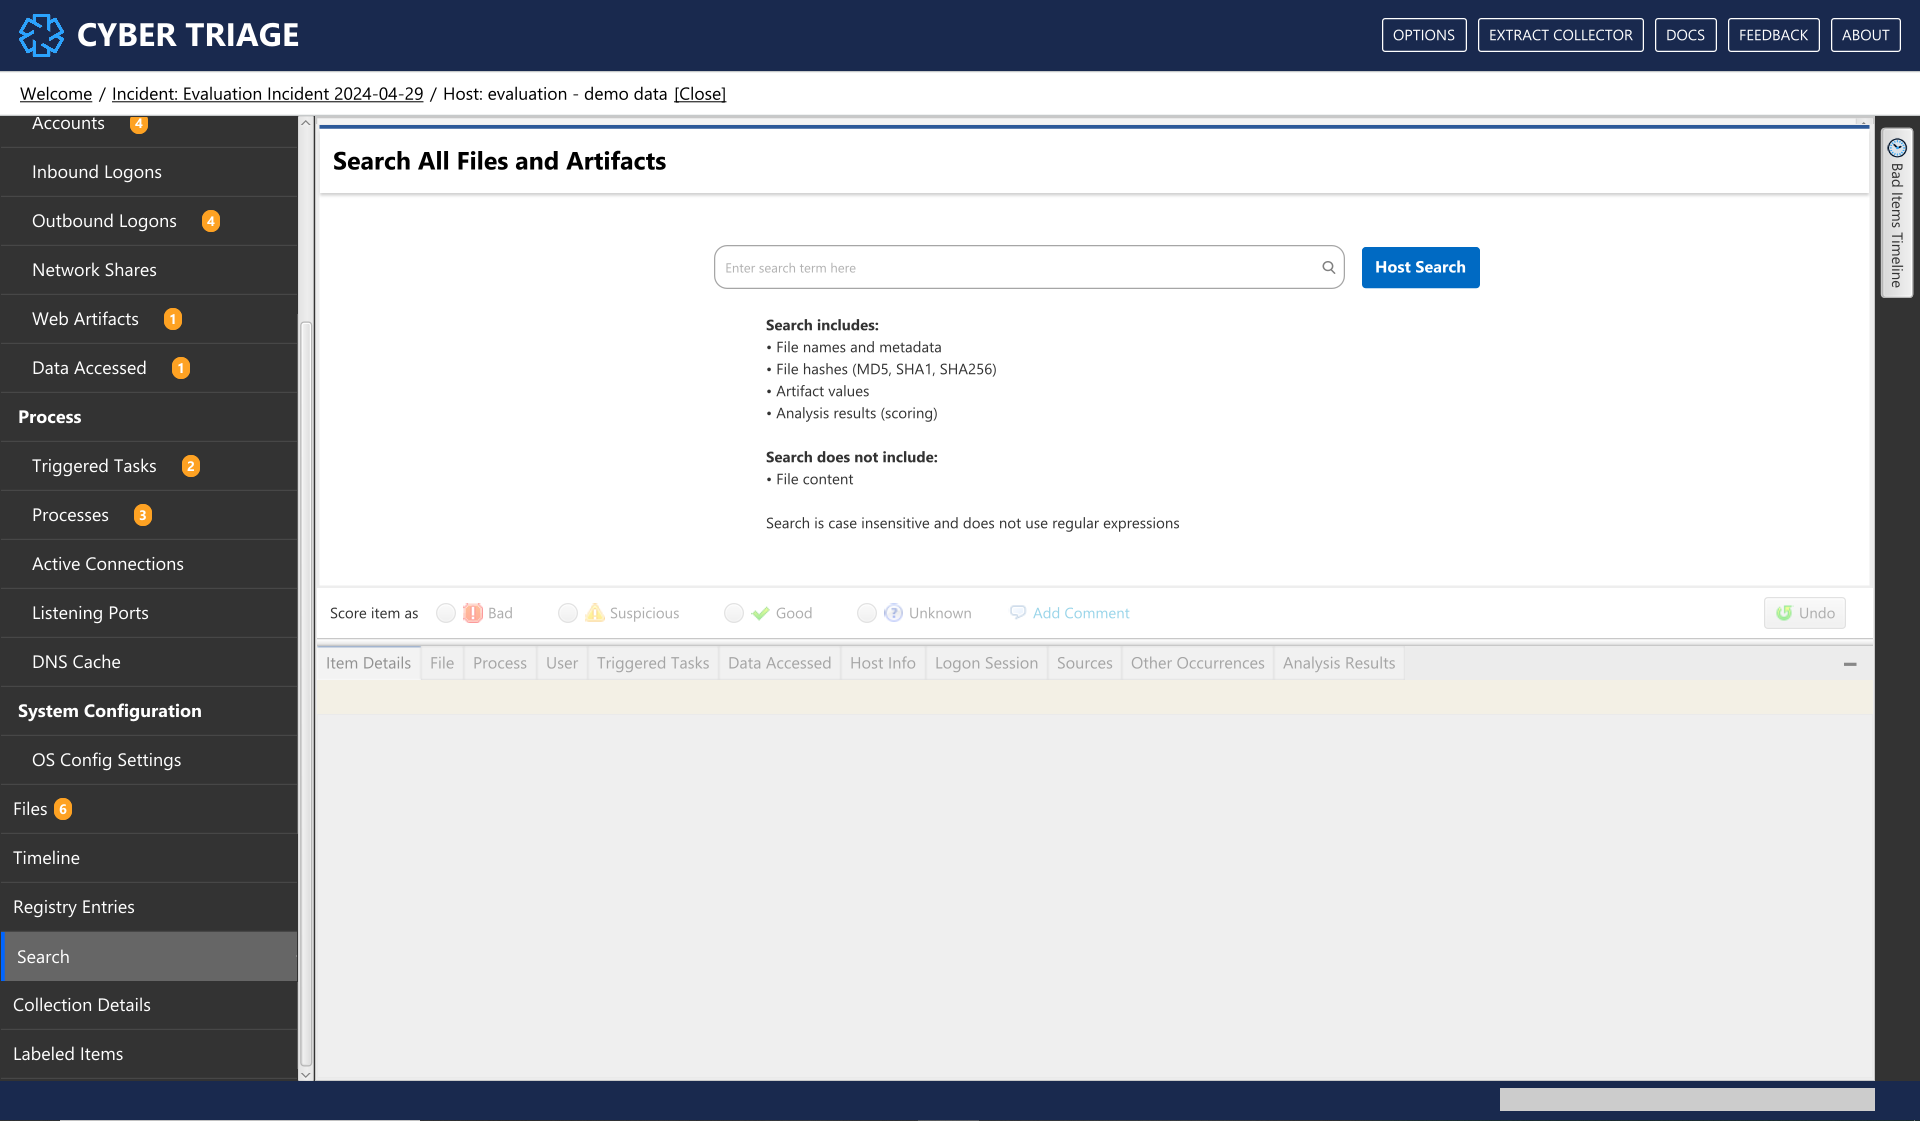
Note that there is also a search bar at the top of other data type-specific UI panels. That will search only the data that is visible in the current table or page. It is not across all types or even pages that are not displayed.
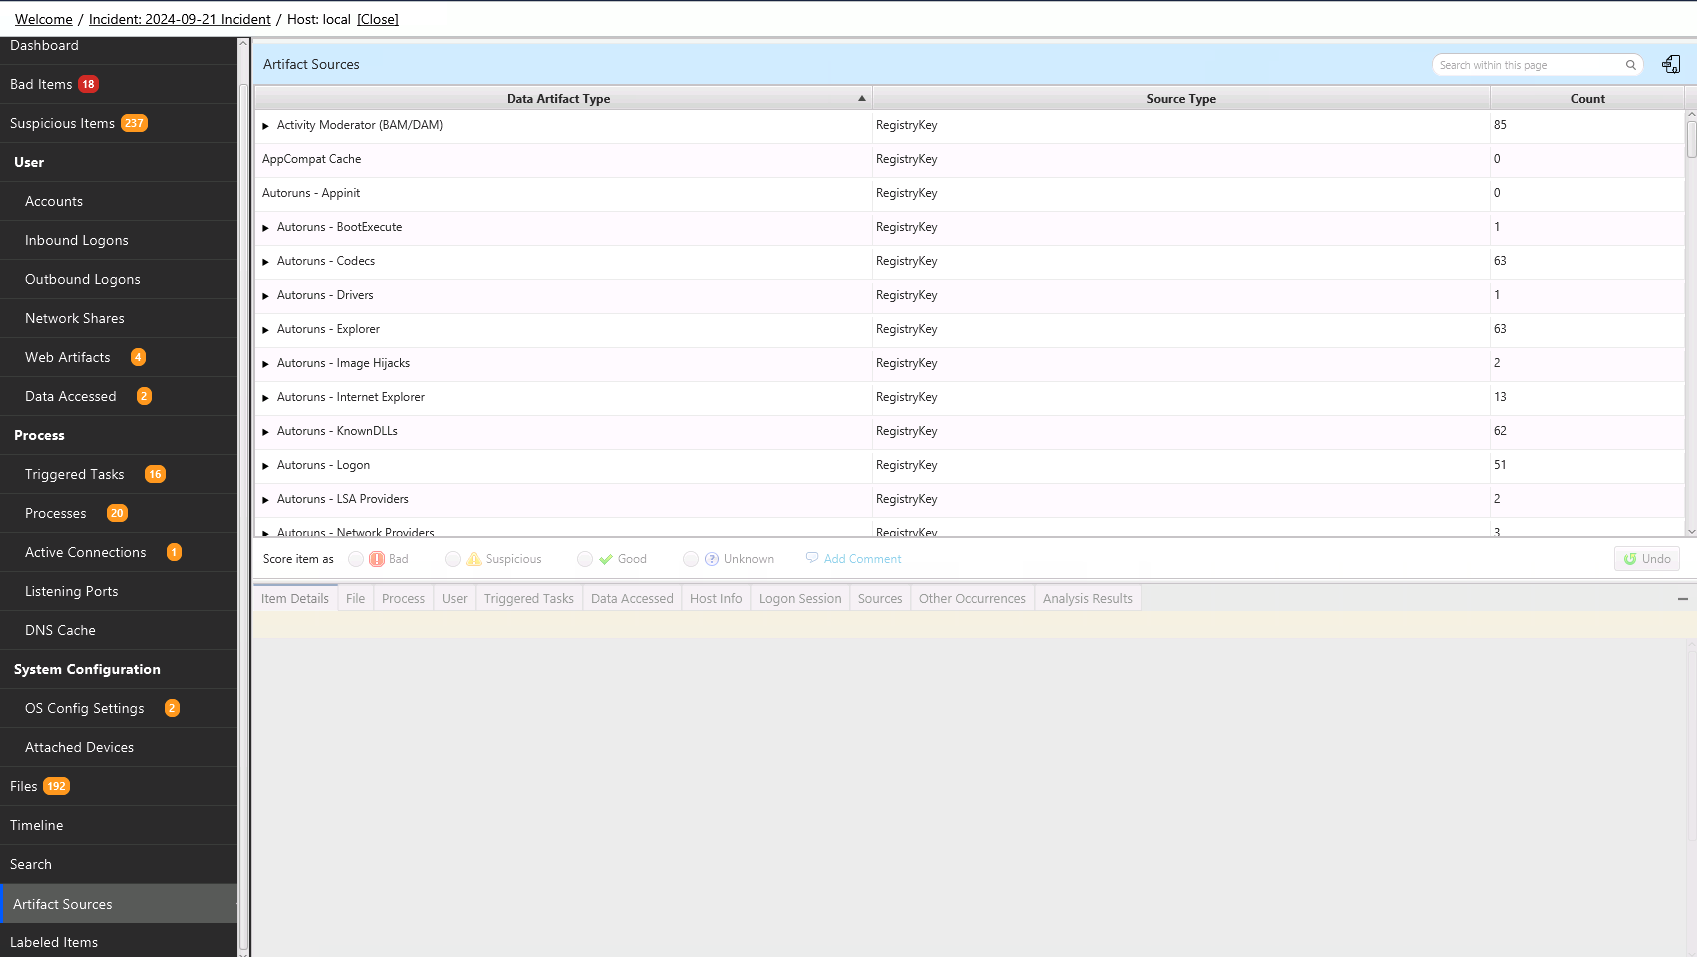
8.10.4. Artifact Sources
The Artifact Sources view allows you to see what “Information Artifacts” Cyber Triage created based on “Data Artifacts”. You’d use this view if, for example, you wanted to validate the Cyber Triage results and see all Processes that were created from Prefetch artifacts.
When you select this option, you will see all of the data artifacts that were used to create information artifacts. Selecting the “Prefech” node will show you all processes that were created from it.
8.10.5. Country Resolution
IP addresses and host names will be resolved to a country using GeoLite2 data created by MaxMind. There should either be a column in each relevant table with this data or it is available in the Hosts tab at the bottom of the screen.