1.2. UI Overview
This section provides a high-level overview of using the Cyber Triage user interface.
1.2.1. Basic Flow and Navigation
The basic flow of Cyber Triage is:
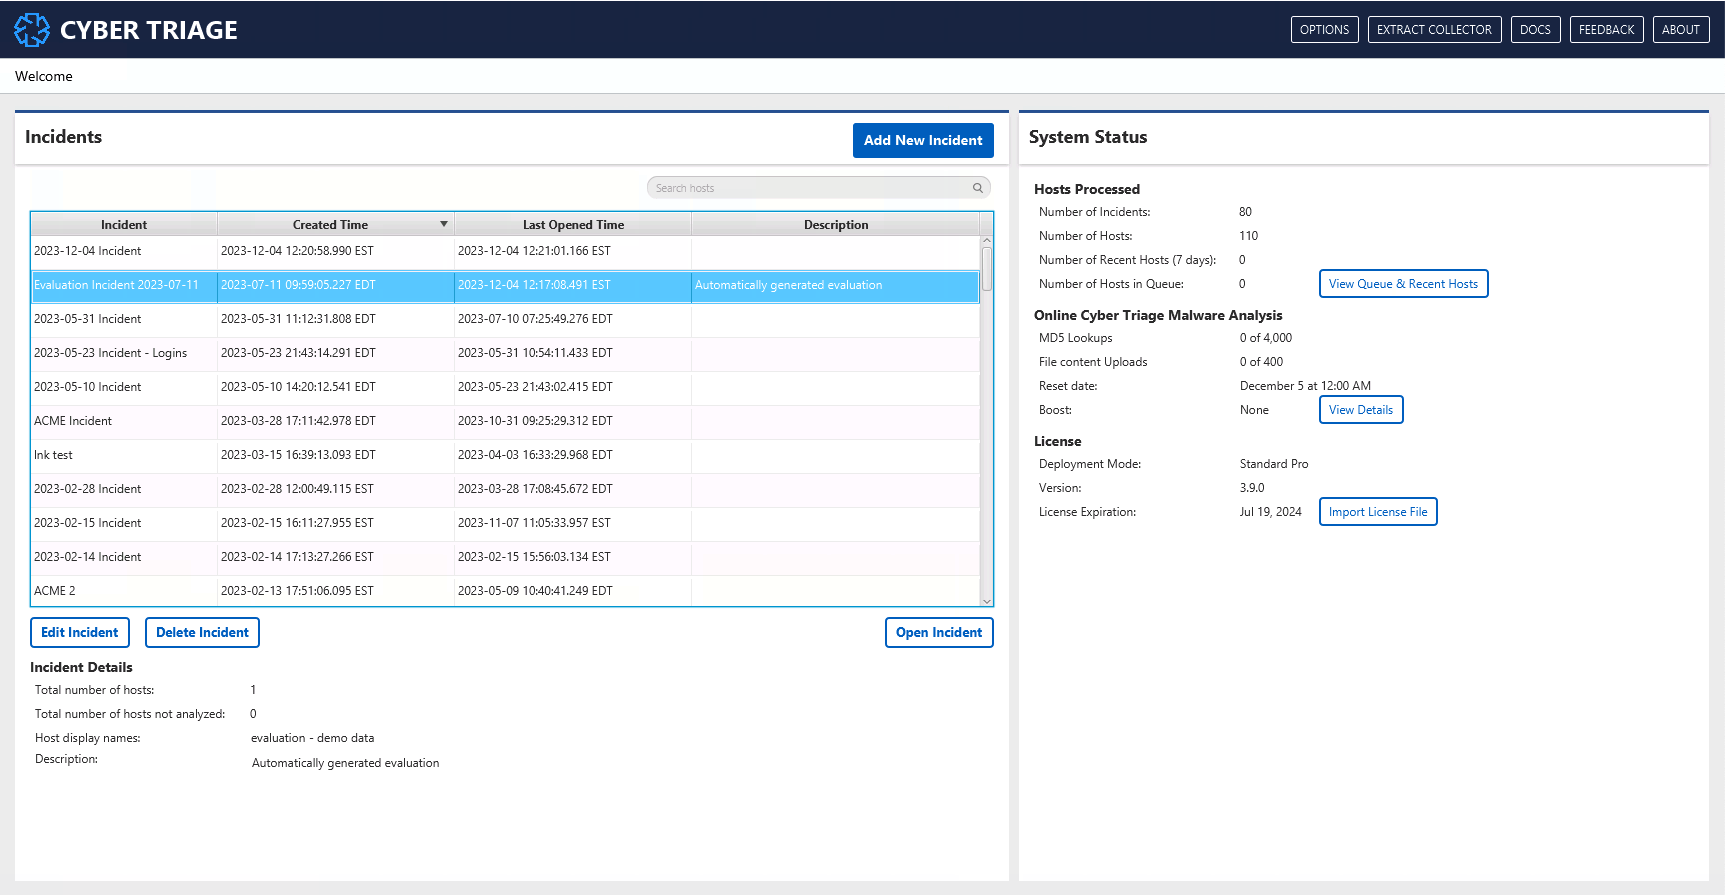
Welcome Page: You will see this when you open the application and it shows you a list of incidents and basic system statistics.
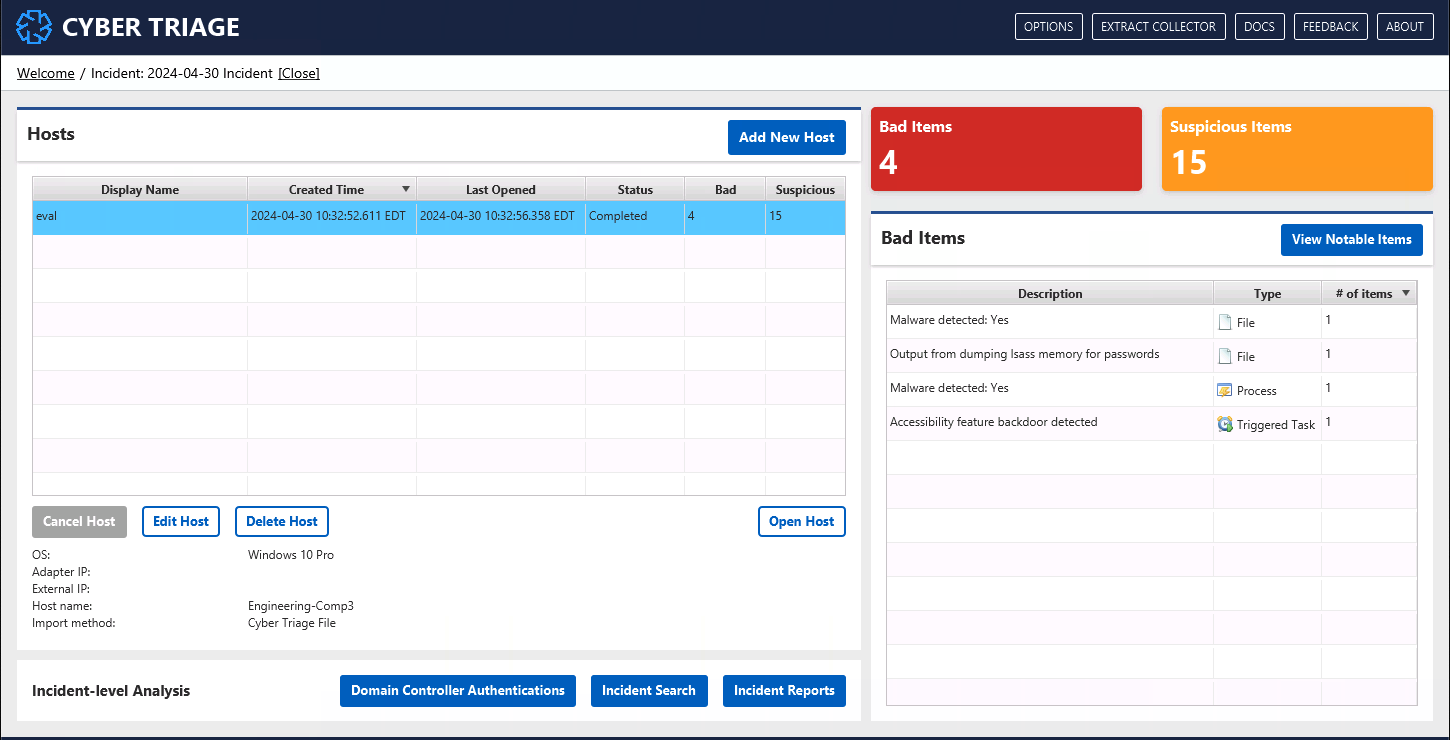
Incident: All data is contained in an incident. When you have one open, you’ll see the Incident Dashboard.
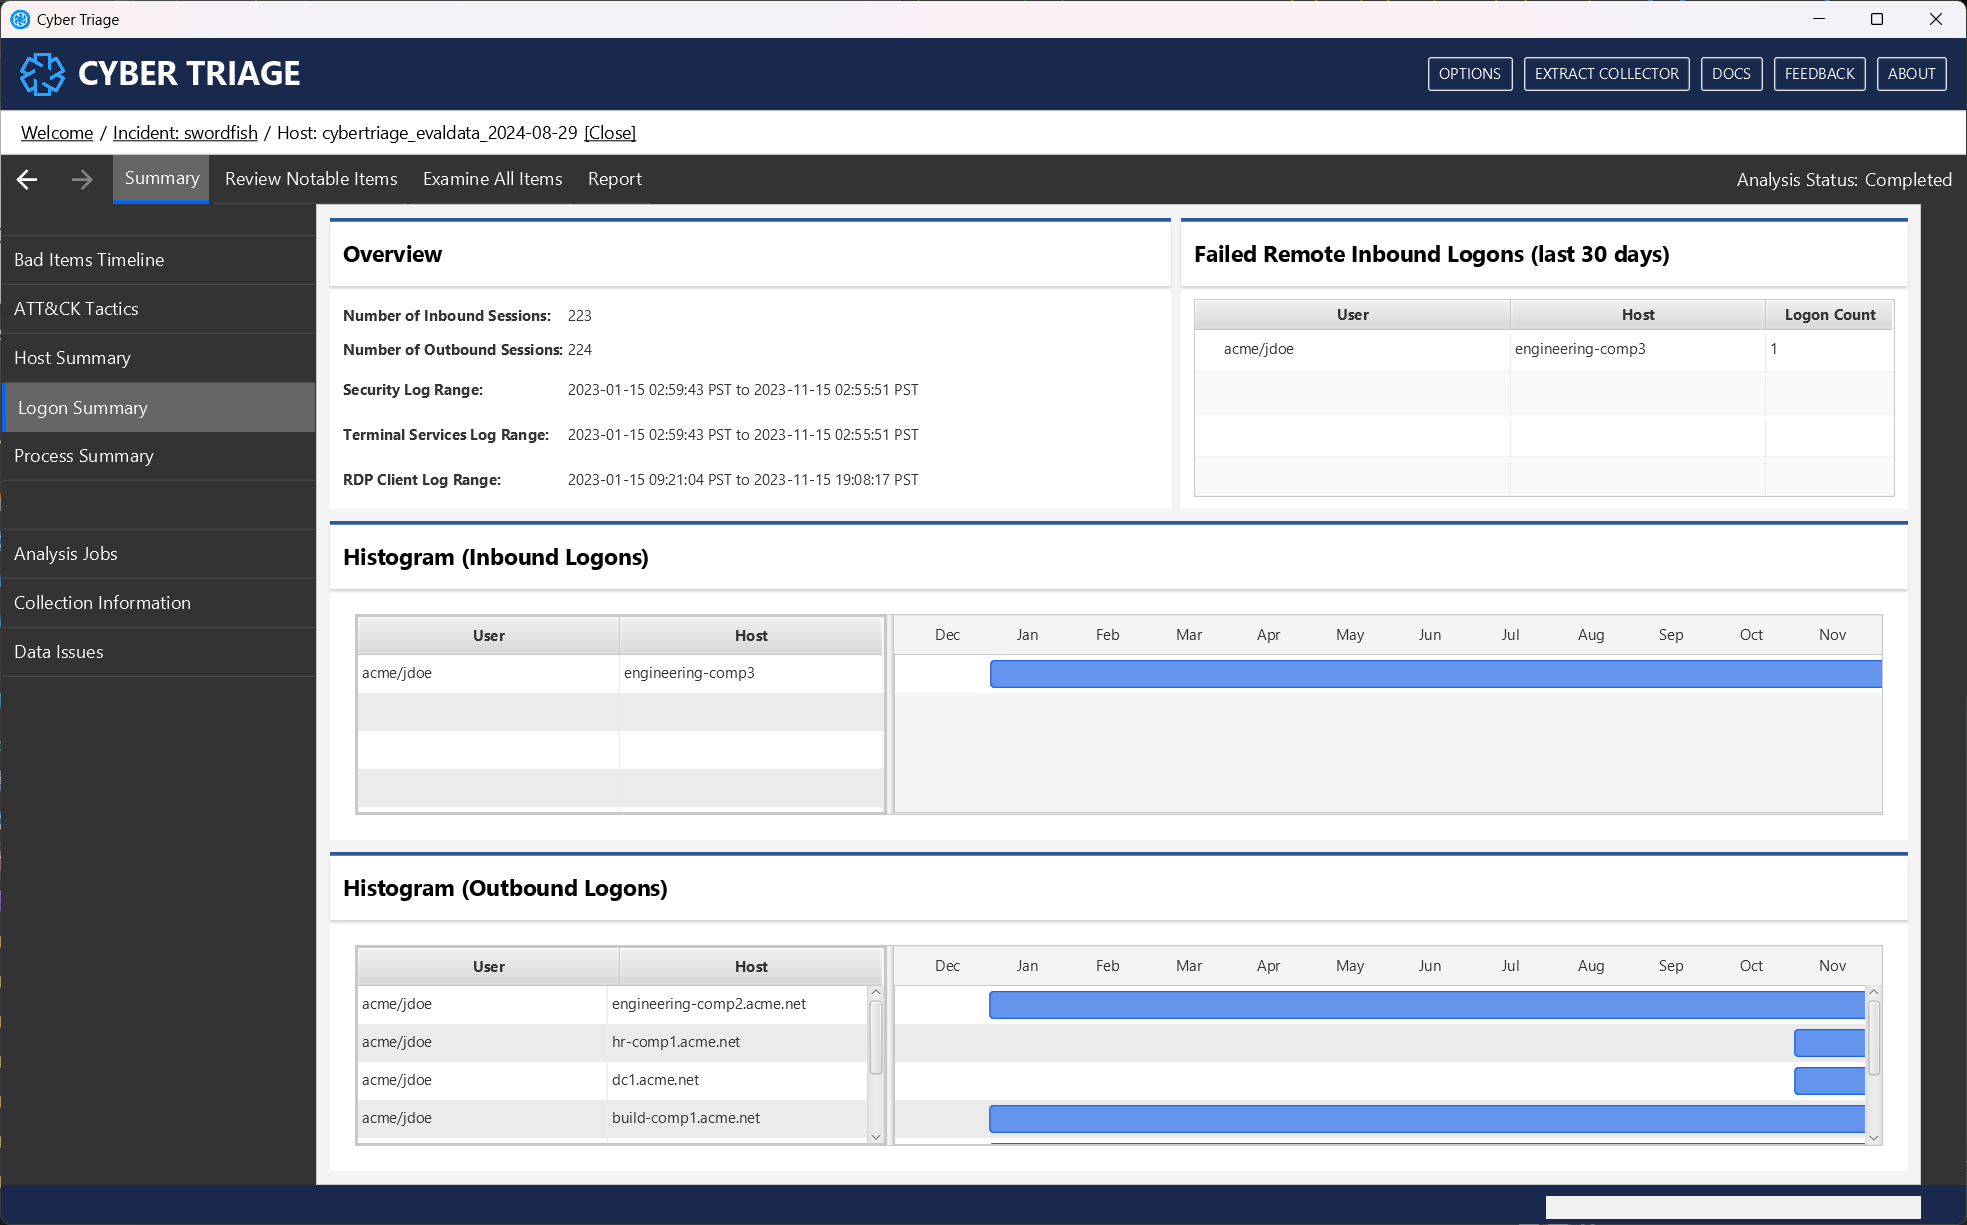
Host: From the incident, you can open a host and see its artifacts and results.
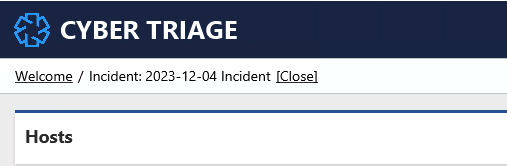
There is a breadcrumb in the upper left. At any point, you can press “[close]” to go up to the previous level.
1.2.2. The Welcome Page
When you launch Cyber Triage, you’ll see the Welcome page (it was shown above).
From here, you can:
Add, delete, and edit incidents (see Incident Management)
Get an overview of system status on the right-hand side.
Use the top menu to get the collection tool, options panel, and provide feedback.
Search indicators from past incidents (see Global IOC Search)
1.2.3. Incident Dashboard
When you have an incident open, the Incident Dashboard (shown above) is your starting point.
It allows you to:
Add and delete hosts in the incident
See progress of analysis on the hosts
Get an overview of bad items to decide which host to manually review
Review a timeline of bad items accross all hosts in hte incident
You can use this data to decide which host to open and examine.
Incident-level Examination provides more details about what kind of analysis can be performed from this UI.