3.5.1. Incident-level Examination
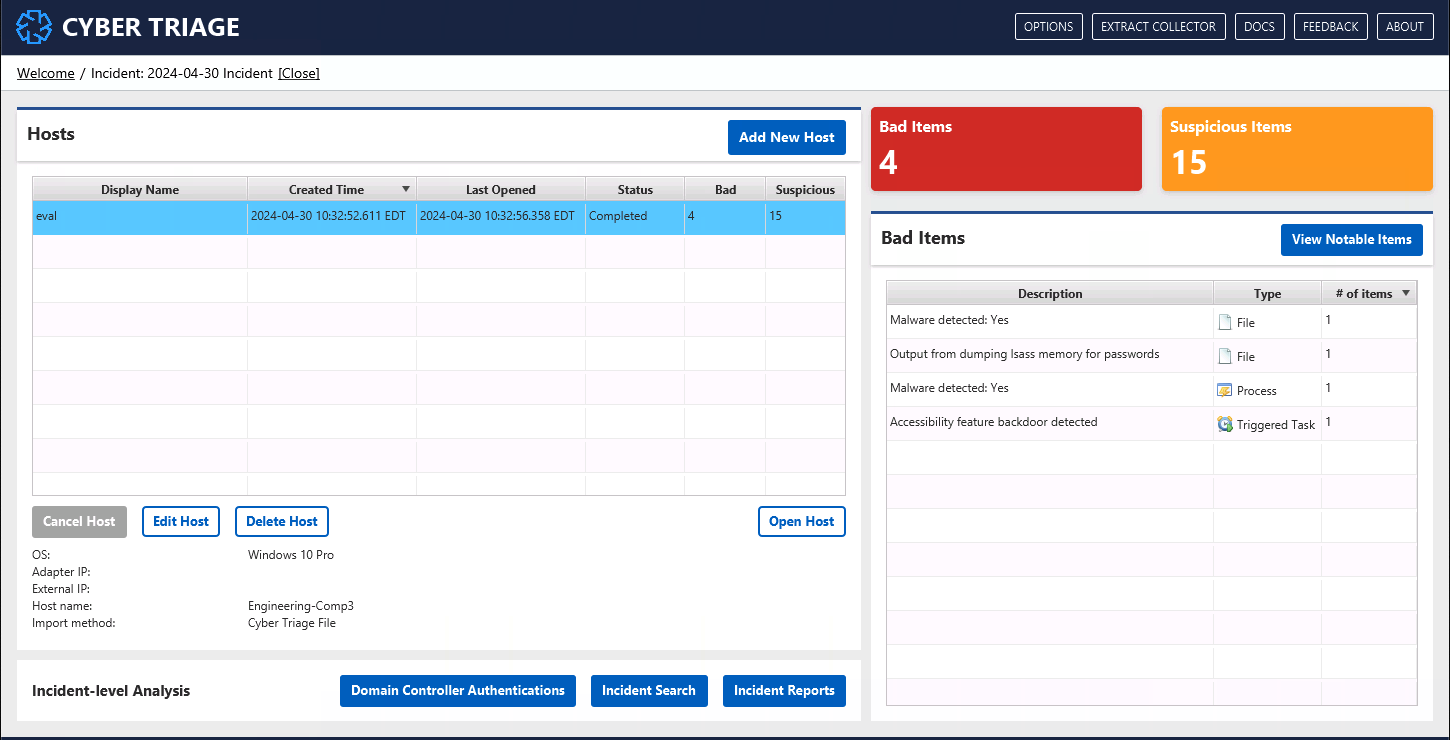
You can review data at the incident-level from the Incident dashboard, which you will see when you either open the incident or close one of the hosts in the incident.

3.5.1.1. Summary of Bad Items
The “Bad Items” table on the right-hand side shows the unique bad items in the incident. If the same item is in multiple hosts, it will be shown only once.
You can use this table to get an idea of what types of bad things are known so far in the incident.
Pressing the “View Notable Items” button there will bring you to the “Notable Items” view that shows each bad and labeled item.

From here, you can use filters on the left to include suspicious items, remove noisy hosts, and data types.
You can also sort here (the default) to create a timeline of bad items across the incident.
From this view, you can press “Open Host” to see more about what happened on the host. That brings you to the UIs that were shown in Host-level Examination.
3.5.1.2. Incident Search
The “Incident Search” button on the Incident Dashboard allows you to search all host data. There are two forms of search:
IOC Search: Search for text in any artifact metadata.
Advanced Search: Search for a specific type of artifact across all hosts that meet your criteria, such as date ranges.
3.5.1.2.1. IOC Search
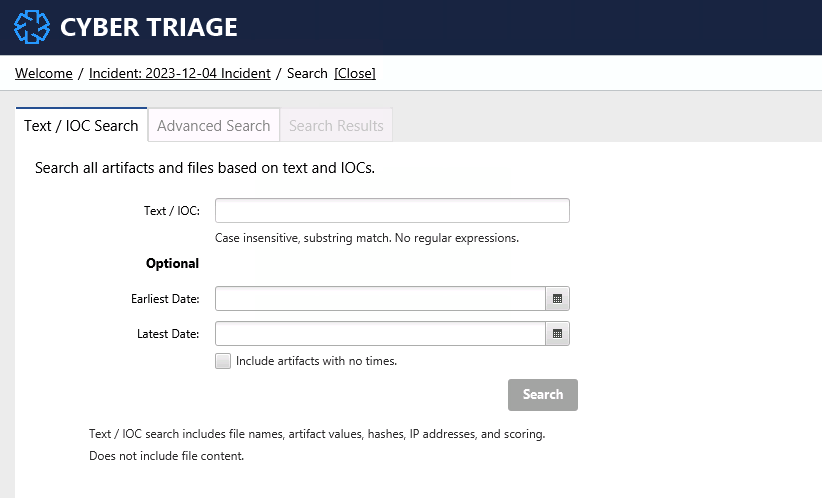
IOC Search allows you to search for text or hash values in any artifact in any host. This is the same feature as the host-level search (see File and Artifact Host Search).

You can enter a text string in the above dialog and artifact metadata will be searched. Note that this is not a full text search of all file content. Metadata only.
This can be slow on large incidents.
A maximum of 5,000 results will be shown. If you hit this limit with your search, consider adding in more date limits.
3.5.1.2.2. Advanced Search
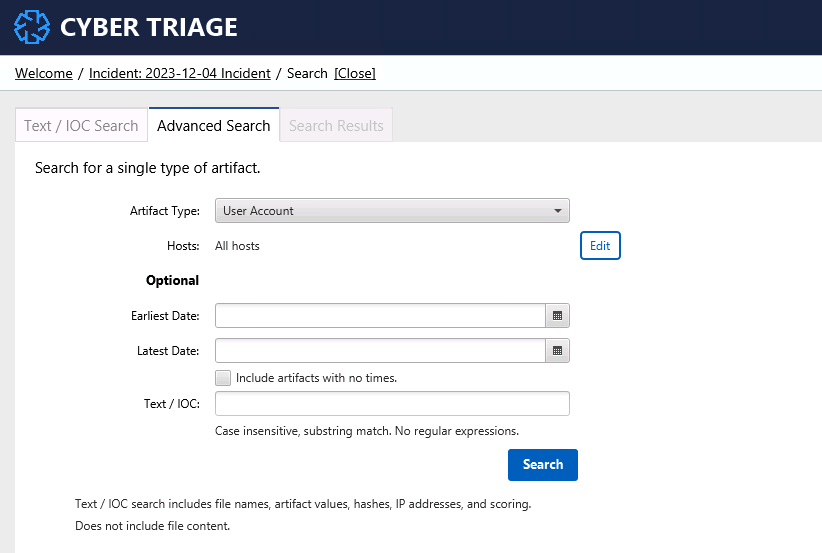
The second form of search is restricted to a specific type of artifact, such as Process or Logon. You can use this search to look for activity related to something you saw on another host.

For example, you may want to search for all other logons in the same time frame as a lot of attacker activity. This could help you pinpoint other hosts to start investigating.
A maximum of 5,000 results will be shown. If you hit this limit with your search, consider adding in more date limits.
3.5.1.3. Domain Controller Authentications
The bottom of the incident dashboard has a button for Domain Controller Authentictaions

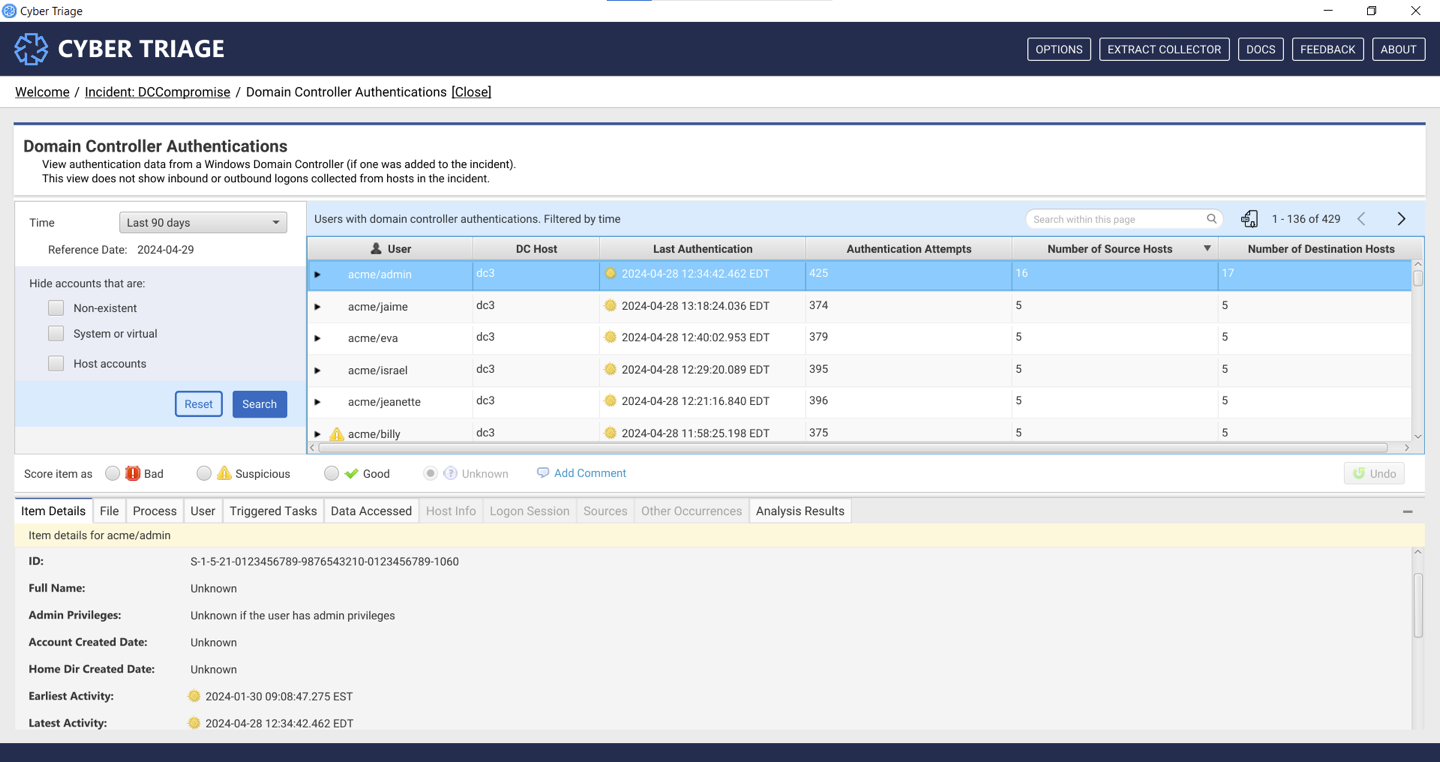
This will take you to a panel that will have data only if you have ingested a Windows Domain Controller into the incident. These computers contain additional event log data that can help you detect lateral movement.
This UI will show you the authentication attempts for each user.

You can use this data to look for accounts with an abnormal number of destination hosts (i.e. a user who is active on many systems).
The data presented here is unique and the following should be noted:
An authentication happens when a host verifies the password with the domain controller. Some authentications happen locally with cached credentials and therefore will not be represented here.
Not all authentication attempts result in a logon. This data represents that a user attempted to authenticate with a host.
Entries will exist in the table for accounts that do not exist. If a spray attack happens, you will see many of these. You can hide them with the filters on the left.
The intended use of this UI is to:
Ingest the domain controller and let it fully process.
- Open this UI and use the filters to focus on:
Past 30 days (or whatever your incident timeline is)
Hide non-existent accounts
Sort by decreasing number of destination hosts
The data will represent accounts that are active on many systems. Some will be IT accounts.
Review the specific authentications for those users.
If that user’s activity is suspicious, ensure you have collected data from the hosts they were active on.
Some teams will start their analysis of an incident with several systems and the domain controller. The domain controller events are used to help scope out where else to collect from.
As of Cyber Triage 3.10, the data here is not fully integrated with other host views. Notably:
An OS Account that is scored as bad on another host that has been added to the Cyber Triage host will not be shown as bad in this interface. Similarly, if an account on the domain controller is scored as bad, it may not show up as bad when looking at an endpoint (unless the user had bad behavior there too). Each user account instance is still being tracked separately.
Logon artifacts found on an endpoint are not yet merged with the authentication artifacts found on the domain controller. Therefore, you may see different data when looking at the domain controller versus what is shown when you open a host. For example, the domain controller may show that a user authenticated from host1 to host2. But, host2 may not have any artifacts showing that if its log files rolled over or had weak audit settings.
The bottom area of this UI once you have selected a user or an authentication will show data only from this host.